Business Transactions

In the previous section, Flow Maps helped us identify latency issues in the LoanServices tier, and the backend database. Now lets take a deeper dive into the business transactions related to the LoanServices tier to identify which transactions are resulting in longer response times.
The Value of Business Transactions
In AppDynamics a business transaction represents the data processing flow for a request, most often a user request. In real-world terms, many different components and dependencies in your application may interact to provide services to fulfill the following types of requests:
- In a financial application, operations such as applying for a loan, buying or selling stocks
- In an e-commerce application, a user searching for items, adding items to the cart, checking out
- In a content portal, a user requests content such as sports, business or entertainment news
AppDynamics orients performance monitoring around business transactions so you can focus on the performance of your application components from the end user perspective. You can quickly identify whether a component is readily available or if it is having performance issues. For instance, you can quickly see if users are able to log in, submit a loan application or view their checking account. You can see response times for users, and the causes of problems when they occur.
Let’s look at the performance of the key Business Transactions to identify and prioritize the ones that need refactoring by following the steps below.
1 . Click on the Business Transactions option on the left menu.
2 . Notice the business transactions that have the highest response times.
3 . Double-click on the /rest/loanVerifyDocumentation business transaction to get more detail about this transaction with high response times.
Notice that five business transactions related to servicing loans are suffering with performance problems. This is key to understanding where we need to focus our efforts during our modernization effort.

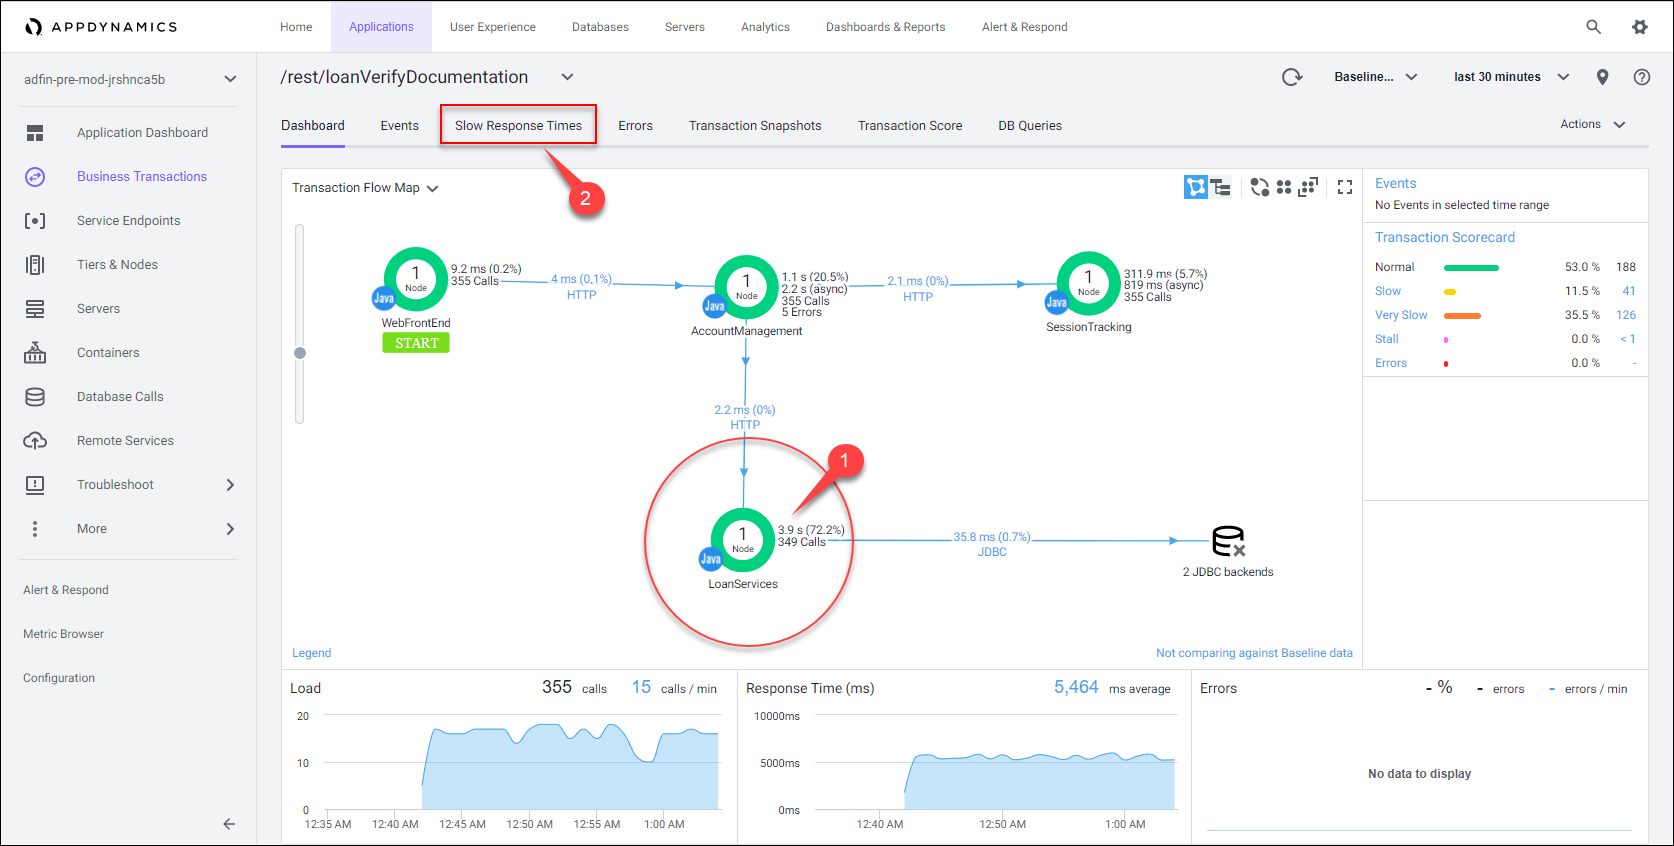
Once you’re in the Business Transaction level Flow Map, you can see that the view has changed to show only the related components and aspects of the /rest/loanVerifyDocumentation business transaction.
1 . Notice that the LoanServices Tier is showing the greatest amount of time spent within this business transaction.
2 . Click on the Slow Response Times tab to look at specific instances where this transaction was slow.
You can read more about Business Transactions here
Transaction Snapshots
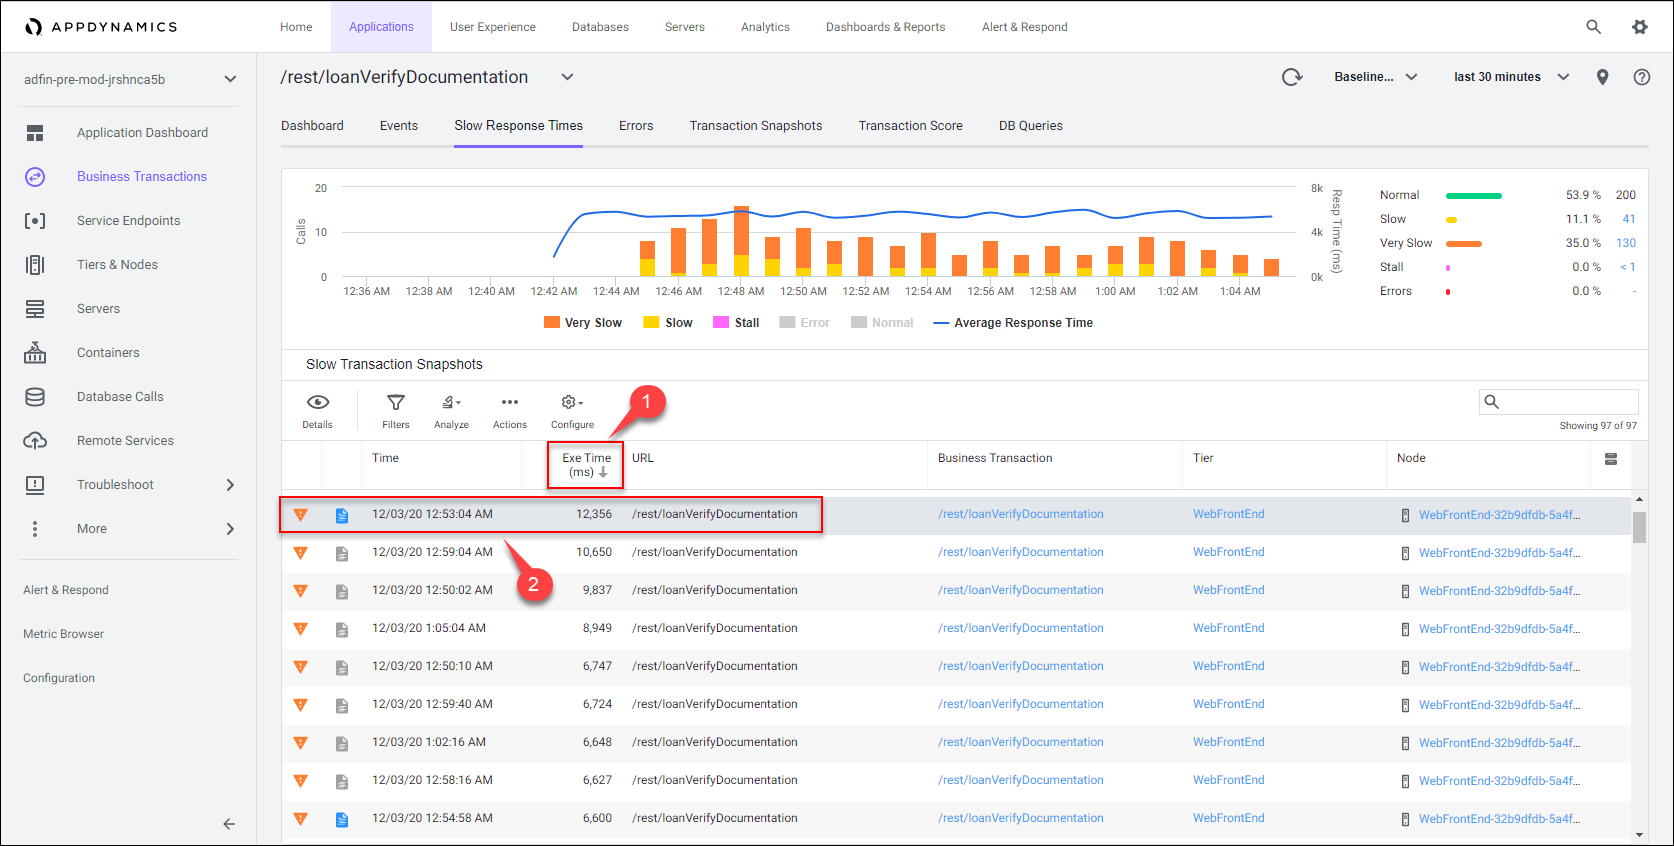
AppDynamics monitors and records every execution of a business transaction in the instrumented environment. However, for troubleshooting purposes, AppDynamics automatically takes a snapshot (containing deep diagnostic information) of specific instances of transactions that are having problems. AppDynamics uses the automatic baselines established for each business transaction to identify the transaction instances that should have detailed snapshots collected for them, allowing for accurate detailed diagnostics during peak production loads.
1 . Click on the Exe Time (ms) column to sort the snapshots by the highest execution time.
2 . Double-click on the Transaction Snapshot instance that has the highest execution time.
This transaction snapshot opens to the call graph view of the Node in the LoanServices Tier that processed this part of the transaction where you can see the following details:
If the snapshot opens to the flow map view first, then click on the “Drill Down” button above the “LoanServices” Tier to get to its call graph view.
1 . The method execution sequence shows the names of the classes and methods that participated in processing the business transaction on this node, in the order in which the flow of control proceeded.
2 . For each method, you can see the time and percentage spent processing and the line number in the source code, enabling you to pinpoint the location in the code that could be affecting the performance of the transaction.
3 . The call graph displays exit call links for methods that make outbound calls to other components such as database queries and web service calls.
You can read more about Call Graphs here

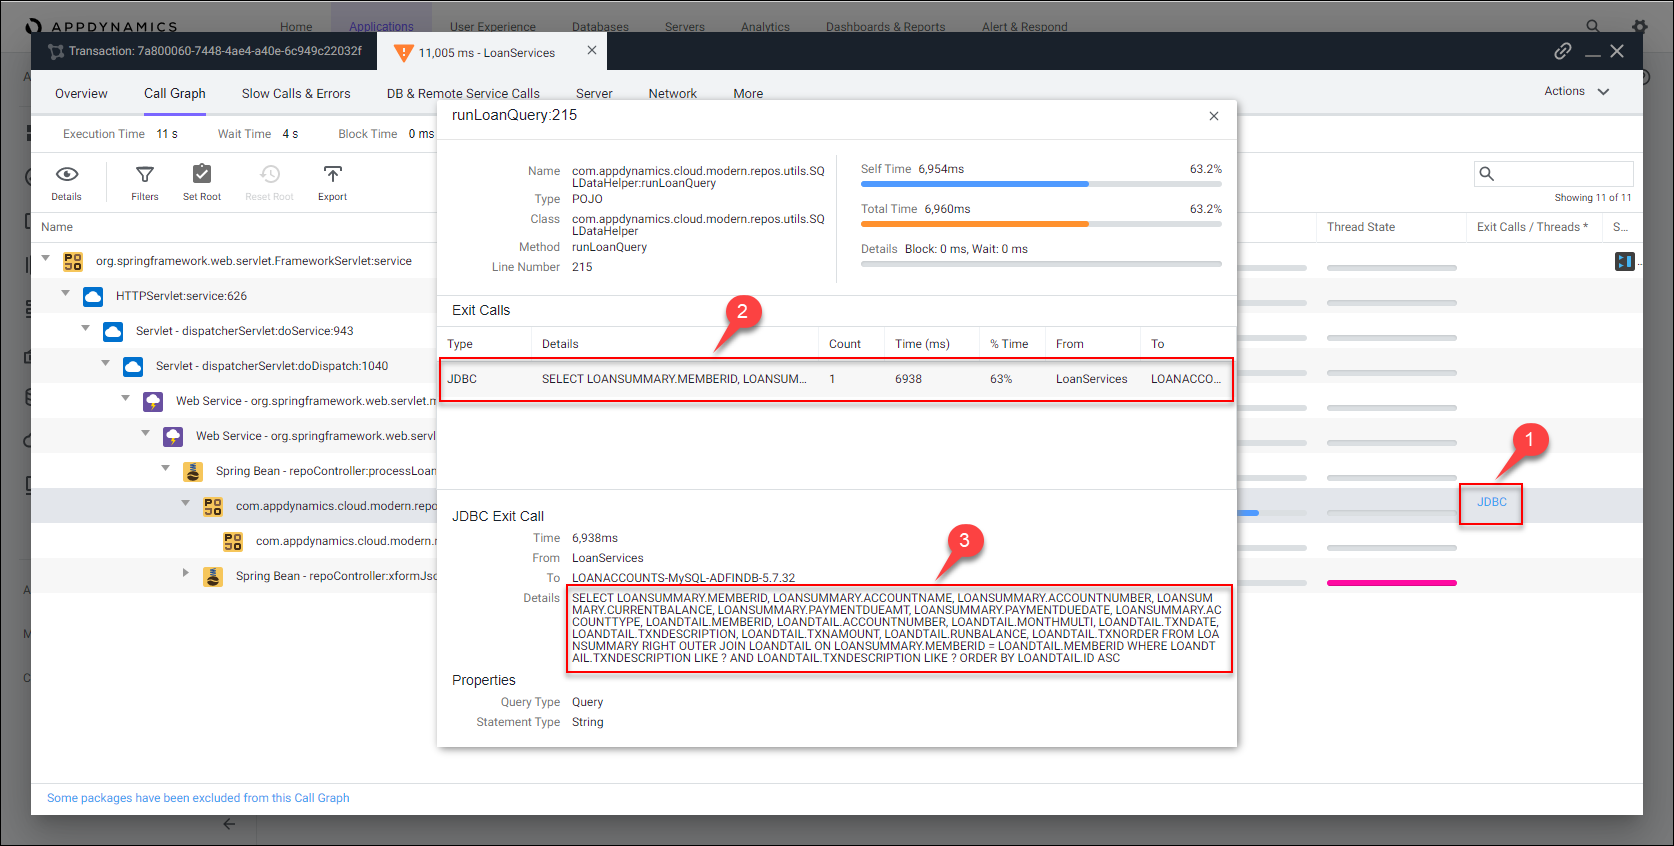
1 . Now click on the JDBC link on the right to open the detail panel for the JDBC database call.
2 . The detail panel for the JDBC database call shows the specific query that took most of the time.
3 . View the full contents of the SQL query, in this case, a select statement that took almost 7 seconds.
SQL Parameter Capture is turned off by default, however it can be turned on if desired.
Here’s the Advantage
- Business Transactions are automatically detected, monitored, baselined, scored, and alerted on OOTB.
- Business Transactions focus on the performance of your application from the end user perspective.
- Business Transactions help you identify and prioritize aspects of your application to refactor and modernize.
- Transaction Snapshots make it easy to find the root cause within problem transactions.
All the dashboards and the snapshot views seen in this section are provided OOTB and the content they contain is real-time, dynamic, and reflects the data gathered from any of the AppDynamics APM Agents.
Takeaways
- The business transactions view helped us easily isolate the 5 problematic business transactions for the loan approval process
- We investigated the loadVerifyDocumentation business transaction and concluded that significant time was spent in the JDBC call to the database
- Nathan and his team now know exactly where to focus and prioritize their refactoring efforts, targeting 5 out of 15 transactions
Next
In the next section we’ll gain deeper insights into database health and performance with AppDynamics Database Visibility.