Deployment

In this section you’ll be performing the following setup and deployment steps: - Create a two node EKS cluster - Deploy the application to EKS - Deploy the server agent to EKS
Create the EKS Cluster
Let’s start by looking at the script that creates the EKS cluster using the commands below in your Cloud9 terminal:
cd /home/ec2-user/environment/modernization_workshop

cat -n create_eks_cluster.sh
The script calls eksctl passing the cluster.yaml file to provide the cluster definition.
Take a quick look at the cluster.yaml file using the commands below:
cd /home/ec2-user/environment/modernization_workshop/applications/post-modernization

cat -n cluster.yaml
Notice where we’ve defined the name of the cluster, the region and availability zones to deploy to, the instance type for the nodes. and the number of nodes.
Notice that the default availability zones defined in the cluster.yaml file are a and c on line number 9 in the image below. It is advisable to run the command below to check that both of those availability zones are supported in your region. You can use the command below to check the supported availability zones in your region. You can read more information about checking availability zones here. You may need to edit the cluster.yaml file to change the availability zones to the ones supported in your region before your create the EKS cluster.
Example command to check for supported availability zones if your region is us-east-2
aws ec2 describe-availability-zones --region us-east-2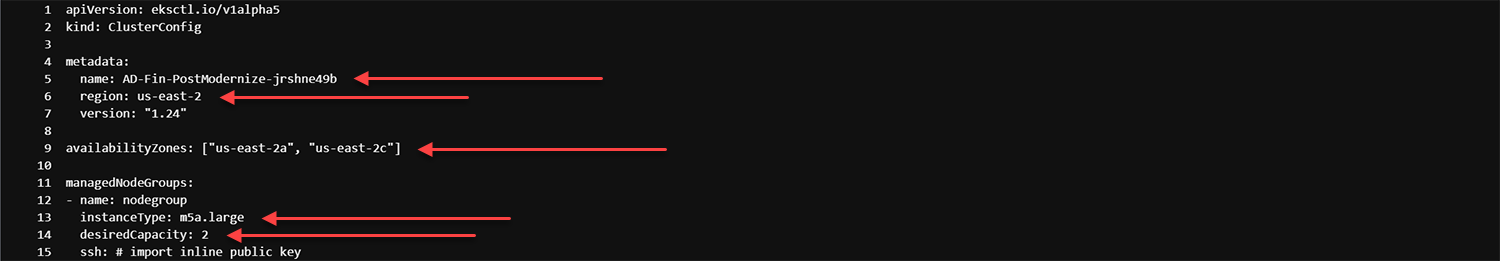
You must have enough available VPCs, Elastic IPs, and NAT Gateways in the region you are working in to successfully create an EKS Cluster with a managed node group of 2 nodes. If you run into a problem during the setup, it is usually associated with insufficient resources or permissions in your AWS account. You can resolve resource constraints by requesting a quota increase for your AWS account.
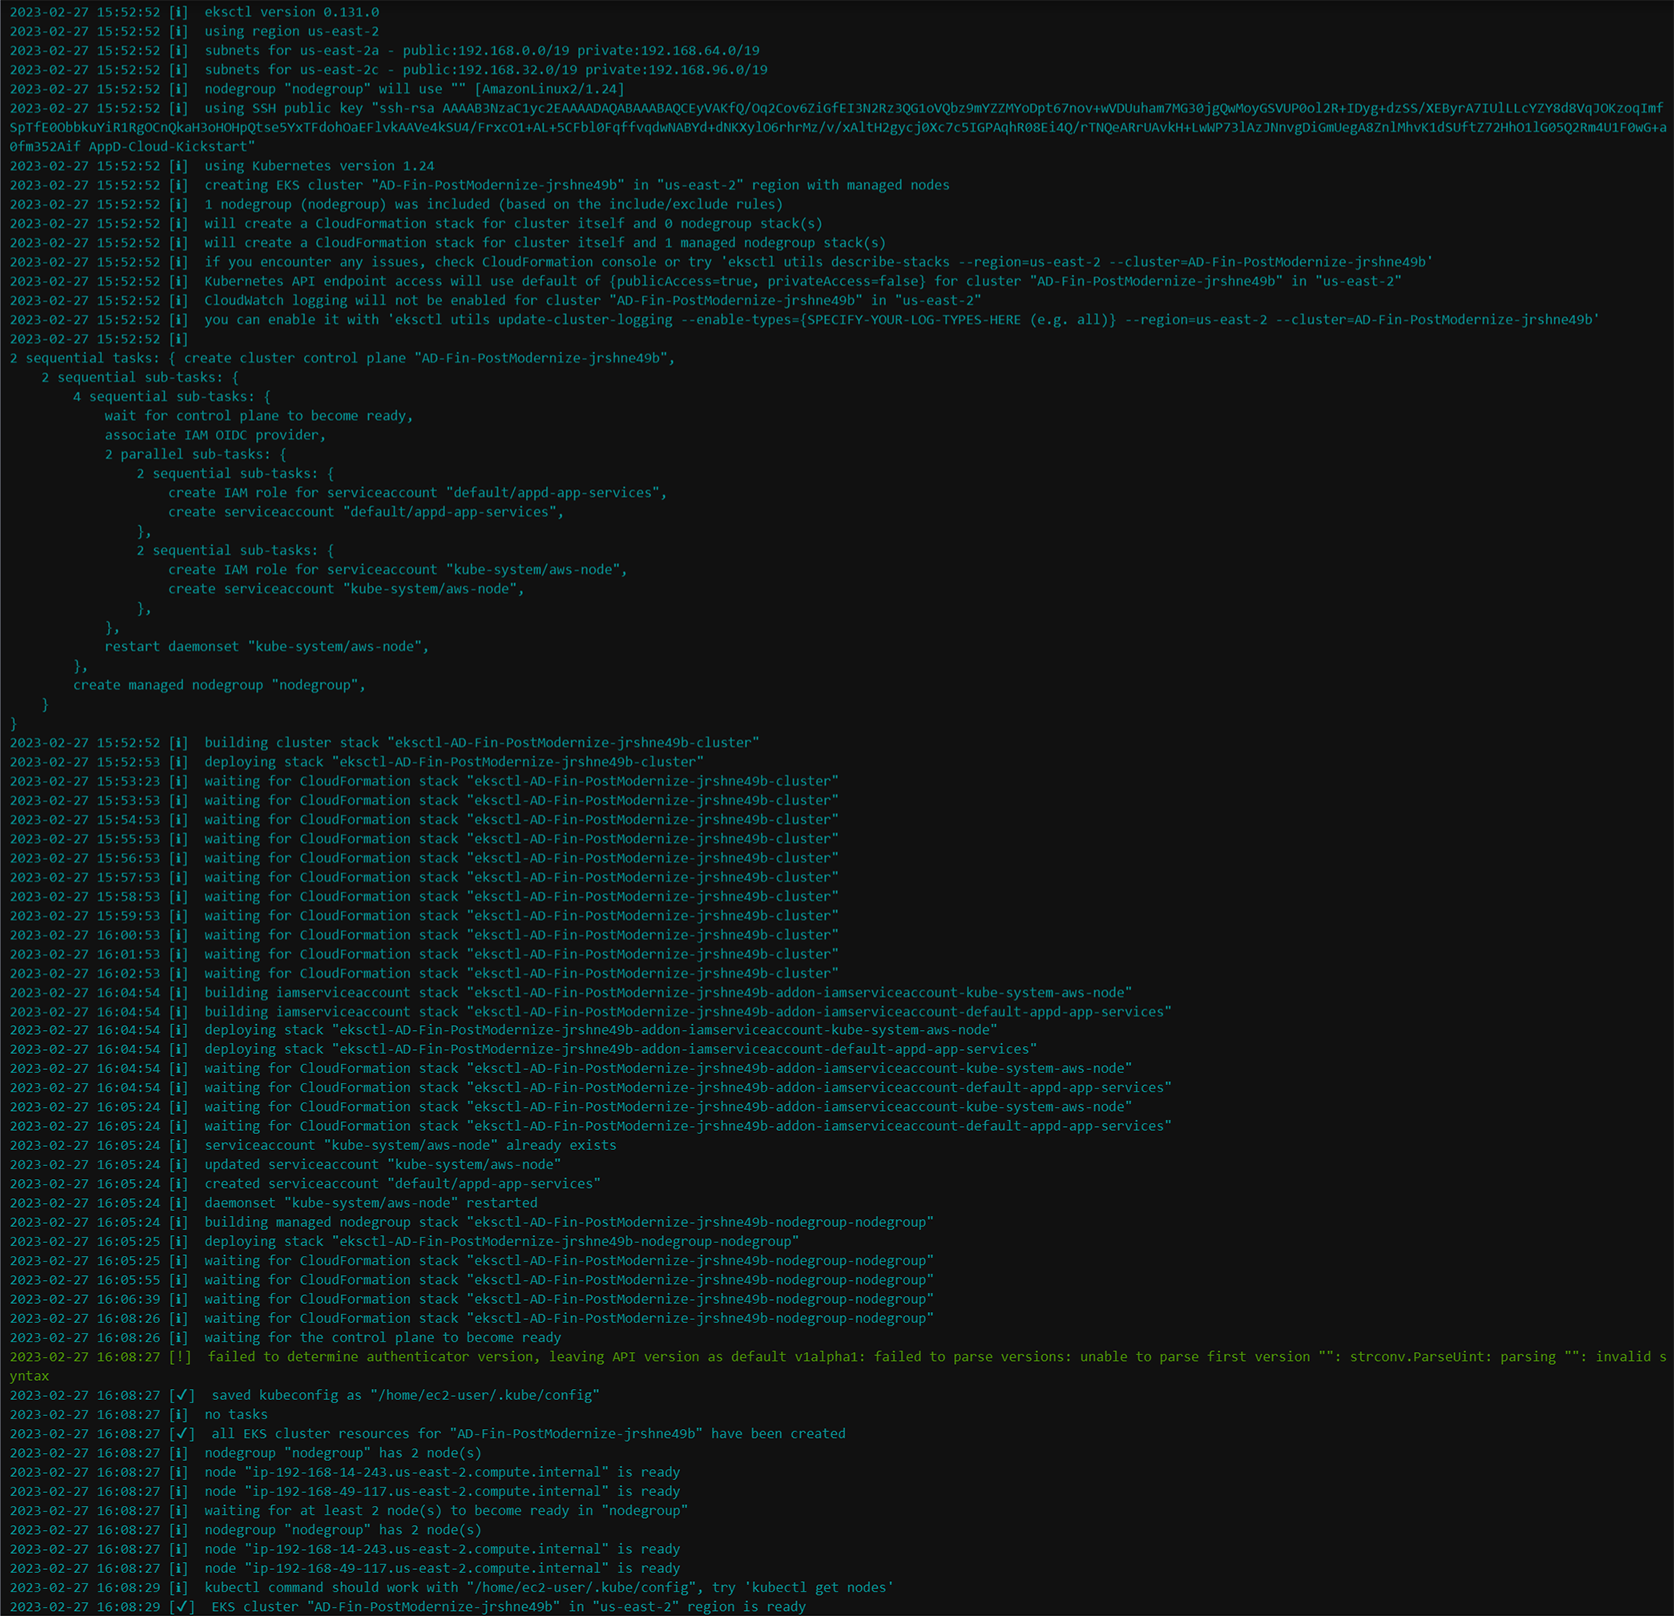
Go ahead and create the EKS cluster using the commands below: - cluster creation takes ~16 minutes to finish so please be patient and let the process complete
cd /home/ec2-user/environment/modernization_workshop

./create_eks_cluster.sh
The image below shows what the output looks like for the EKS cluster creation.
Deploy the Application to EKS
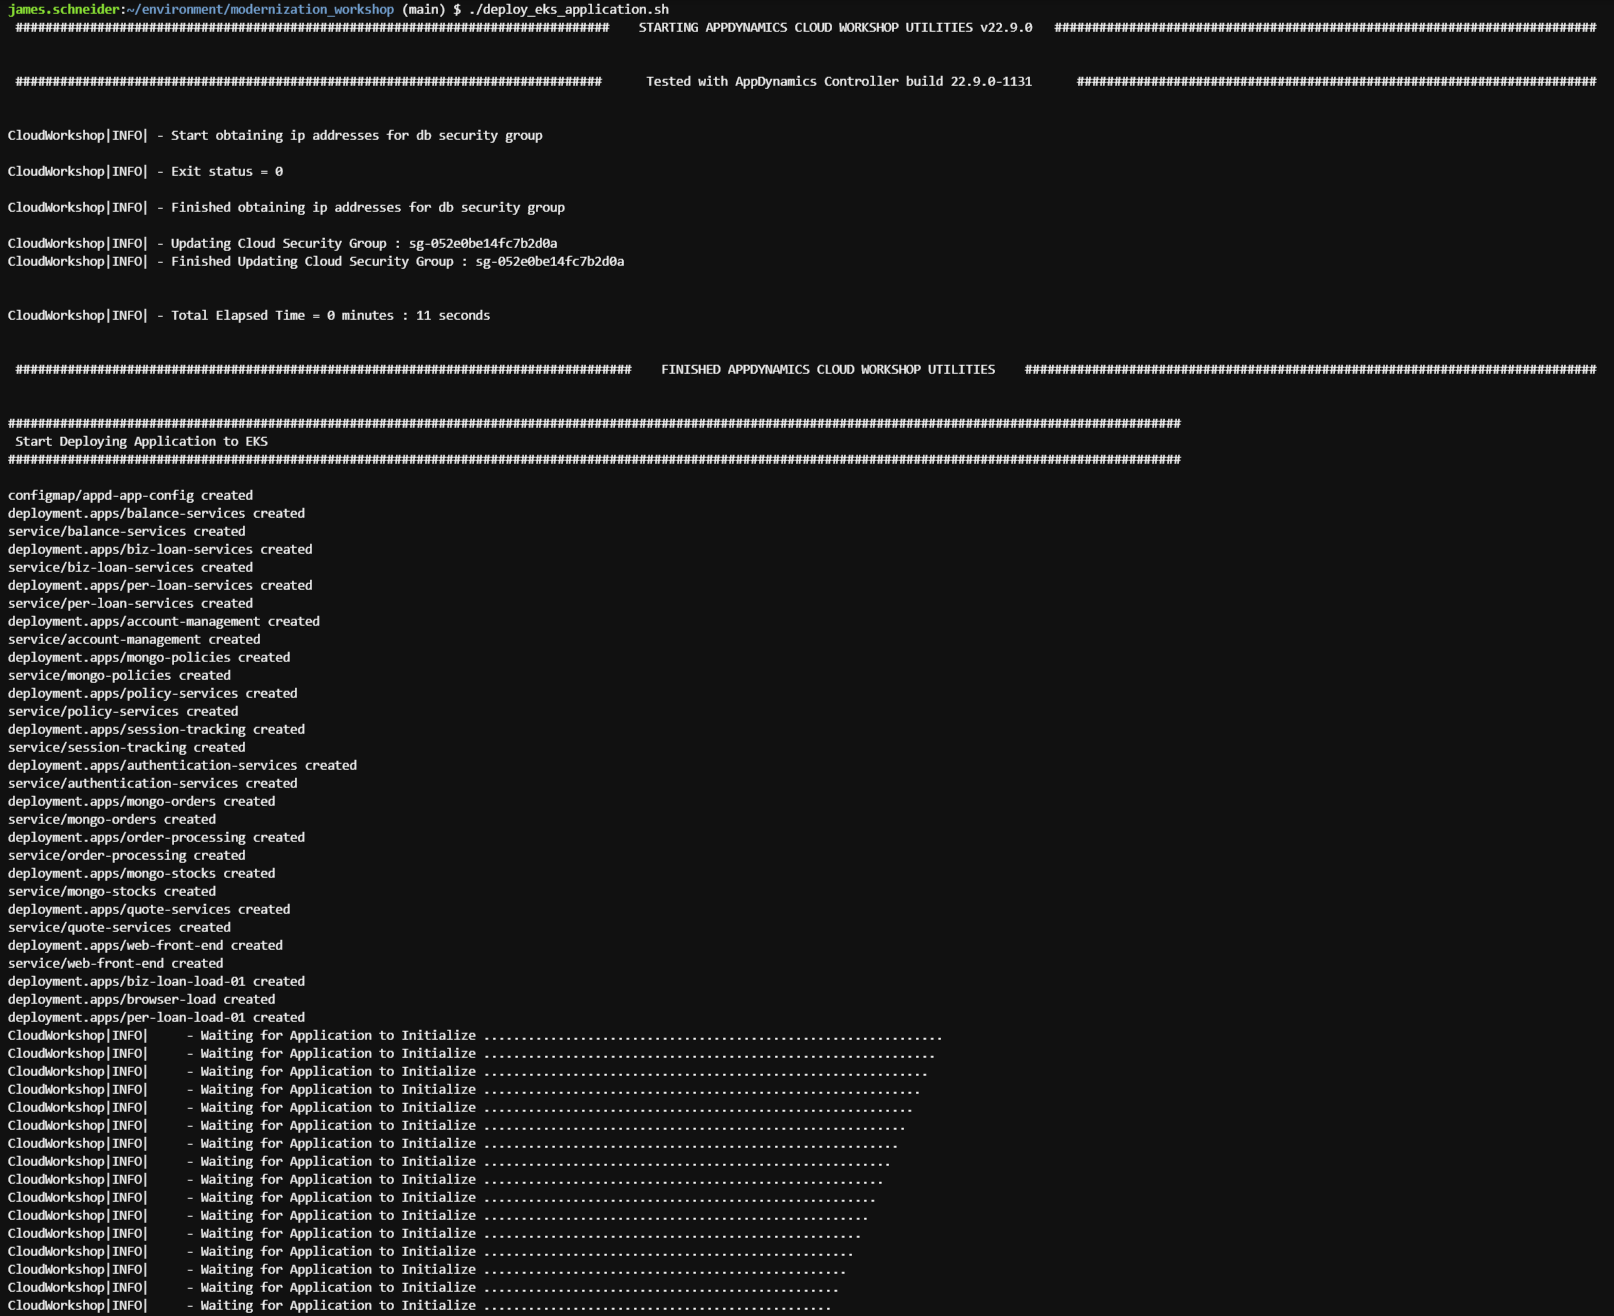
Now that the EKS cluster is up and running, use the commands below to deploy the modernized application to EKS: - deployment and initialization takes ~3 minutes to finish
cd /home/ec2-user/environment/modernization_workshop

./deploy_eks_application.sh
The image below shows what the output looks like for the application deployment and initialization.
Deploy AppDynamics Agents
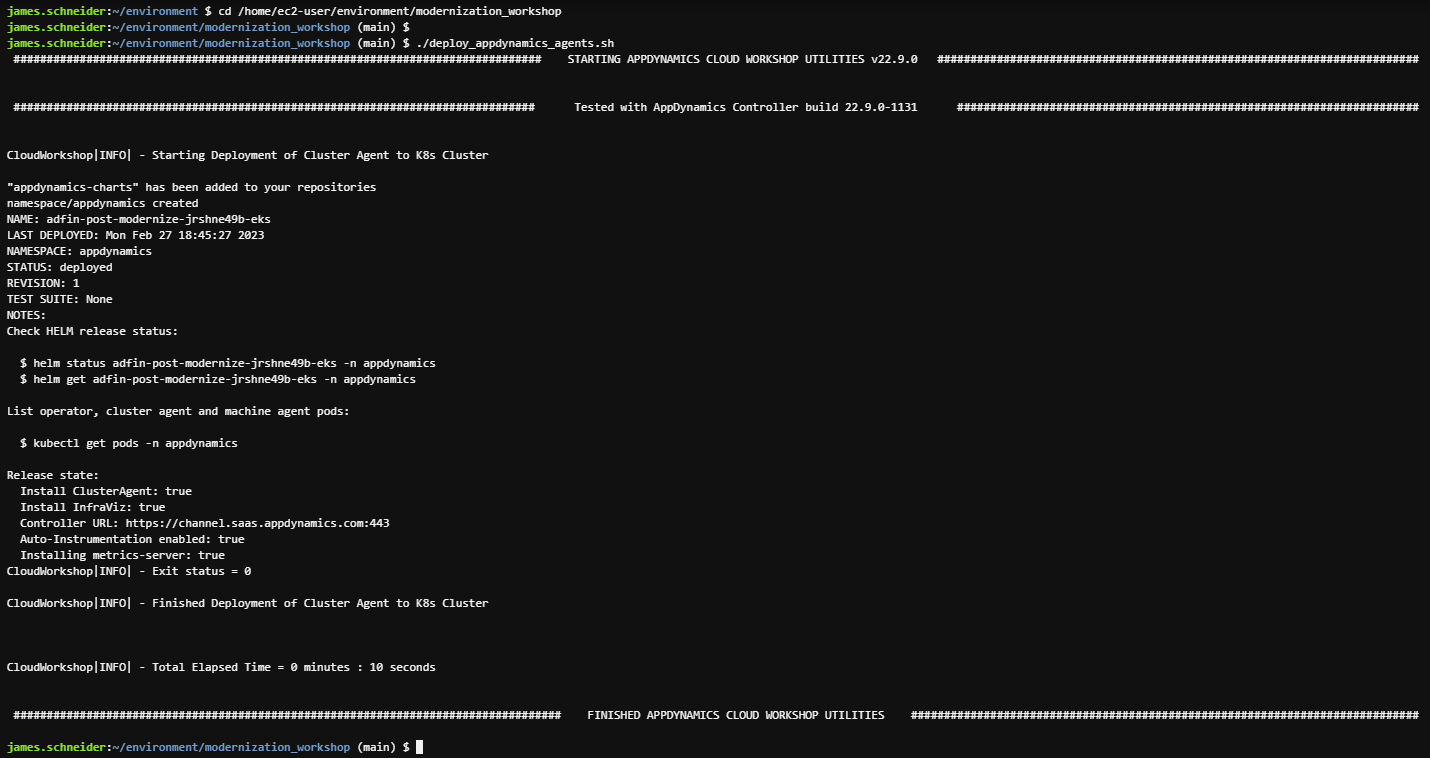
Use the commands below to deploy the AppDynamics agents to the EKS Kubernetes cluster.
cd /home/ec2-user/environment/modernization_workshop

./deploy_appdynamics_agents.sh
The output should look like the image below.
What AppDynamics agents were deployed and how?
Though there are several different ways to deploy these agents, we’ve used the AppDynamics Helm Chart that simplified the deployment of agents to the Kubernetes clusters.
Below is the list of agents deployed by the Helm chart:
- Cluster Agent
- Java APM Agent
- Server Visibility Agent
- Network Visibility Agent
- Secure Application Agent
How is the Helm chart configured?
In our deployment we are overriding the helm chart default values.yaml file to provide the specific configuration for our environment.
Use the command below in your Cloud9 terminal to view the template file used to generate the final version of the values.yaml file that is used in our deployment.
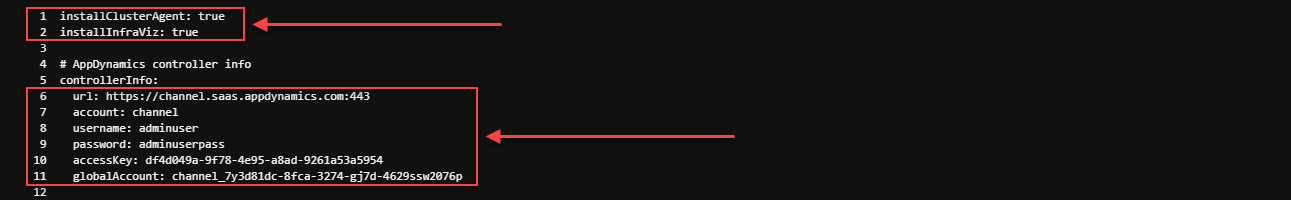
cat -n /home/ec2-user/environment/modernization_workshop/applications/post-modernization/clusteragent/values-ca1.yaml- On line 1 and line 2 we are specifying that we want to deploy the Cluster Agent and the Server Visibility Agent.
- On lines 6 through 11 we- On lines 6 through 11 we will provide the connection details to the AppDynamics Controller.
- On lines 8 and 9 the username and password for an AppDynamics Controller user with elevated privilages are required only if you are configuring Auto-Instrumentation of APM Agents which we’ll look at in the next section.
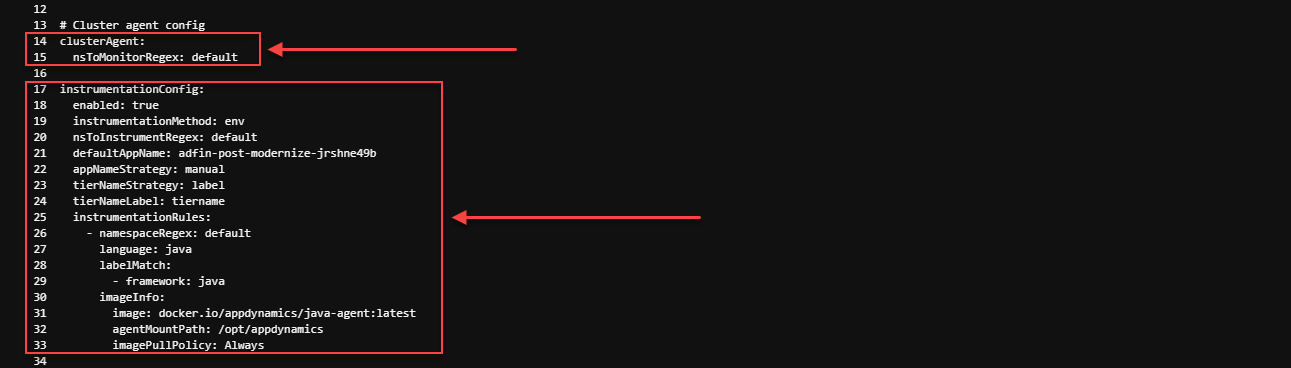
- On line 15 we are specifying the namespace(s) we want the Cluster Agent to monitor.
- On lines 17 through 33 we see the configuration for the Auto-Instrumentation of APM Agents
- In this case we have one instrumentation rule defined for the Java APM Agent to label match on deployments with the framework: java label, as seen on lines 28 and 29
- Also, take note of lines 21 through 24 where we are telling the auto-instrumentation to use the Application Name we have defined here and to use the Tier Names that are set for each service deployment in their Kubernetes deployment Yaml file which we will look at an example of next
Now let’s take a look at the Kubernetes deployment Yaml file for the AccountManagement service deployment to see how we used the label match from the Auto-Instrumentation section of the values-ca1.yaml used to deploy the AppDynamics agents, using the command below.
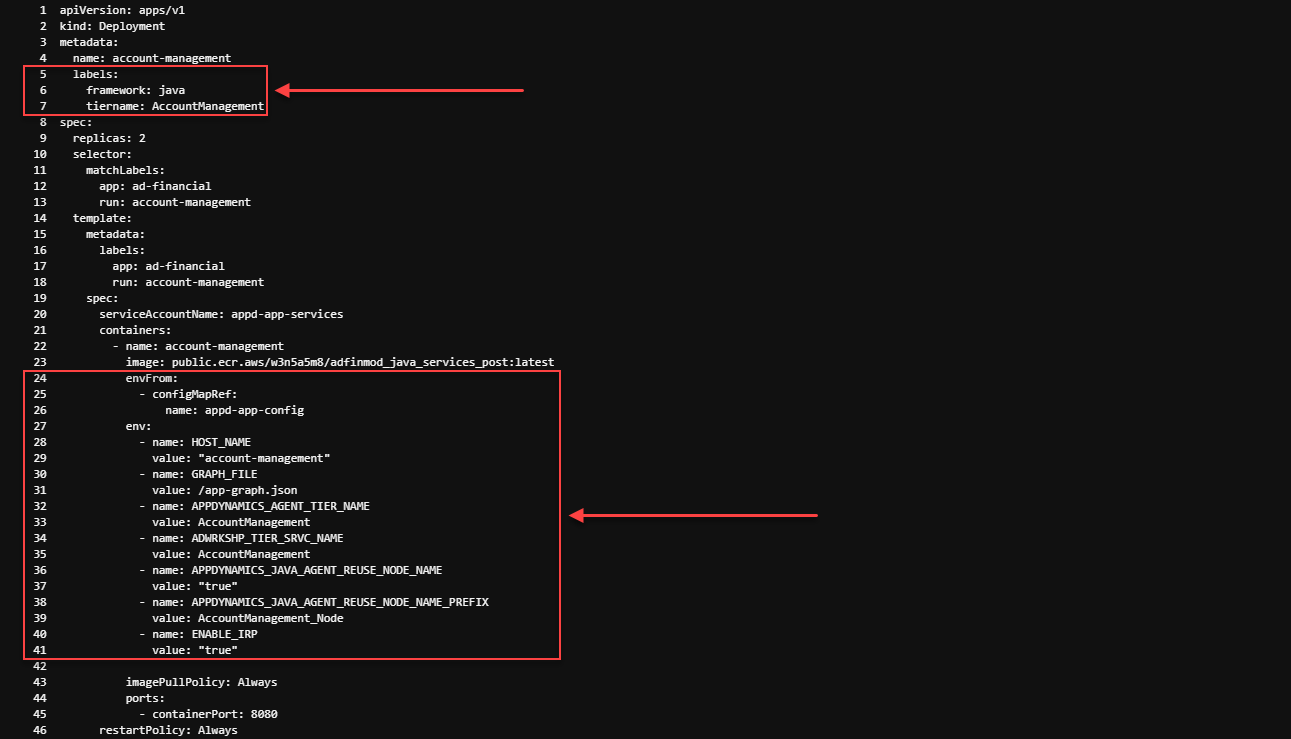
cat -n /home/ec2-user/environment/modernization_workshop/applications/post-modernization/application/account-management.yaml- On line 6 we are providing the label that matches to line 29 in the values-ca1.yaml file that tells the Cluster Agent to auto-instrument this deployment.
- On line 7 we are providing the label that matches to line 24 in the values-ca1.yaml file that tells the Java Agent to use the Tier Name of AccountManagenment for this deployment.
- On lines 24 through 26 we are referencing the modernization_workshop/applications/post-modernization/application/config-map.yaml for some of the required environment variables for the application
- On lines 27 through 41 we are setting some required environment variables for this specific deployment/service in an in-line fashion
Database Visibility Agent
The AppDynamics Database Agent is a standalone Java program that collects performance metrics about your database instances and database servers. You can deploy the Database Agent on any machine running Java 1.8 or higher. The machine must have network access to the AppDynamics Controller and the database instance that you want to be monitored.
A single database agent can monitor multiple databases at once by using multiple database collector configurations. The workshop setup utility installed the agent on your Cloud9 instance and also created two database collector configurations inside the controller. You can see the running agent process by using the command below:
ps -ef | grep db-agentIn the case of the database agent, JVM command line properties were used to connect the agent to the controller. Take notice of the “-Ddbagent.name” property. This property is used to link a specific database agent to a database collector configuration. Most of these properties could have optionally been defined in the agents configuration file, which can be seen by using the commands below:
cd /opt/appdynamics/dbagent/conf

cat controller-info.xml
The image below shows an example of the database collector configuration to monitor the MySQL database used in the post-modernized EKS application.
Once the database agent is running with a specific name, its name should appear in the drop-down of available agents so you can associate it with the collector you’re creating. Since this is an RDS database, we have used the RDS endpoint as the hostname. We can use the port “3306” for the DB since we have exposed it specifically in the VPC Security Group for the database.
You can see that we have used the “root” username and password to connect to the database and monitor it. The recommended practice is to create a specific database user in the database and apply specific permissions to it for monitoring purposes.
You can read more about deploying the database agent and configuring collectors here and here

Next
Let’s follow Alex and his team as they utilize AppDynamics, having purpose built integrations for AWS that provides application performance monitoring continuity throughout the entire application modernization architecture lifecycle.