Cluster Agent

The AppDynamics Cluster Agent enables Ginas’ CloudOps team to get deep level visibility into EKS clusters, including every node, pod, and namespace down to the container level. The Cluster Agent utilizes the existing Kubernetes Metrics Server API to bring back key performance data at the cluster, namespace, and node level. The agent displays metrics on Events, Pods, Deployments, Daemon-sets, Jobs, Services, Service Endpoints, Quotas, Configs, Containers, and Resource Limits.

Navigate to the Cluster Dashboard
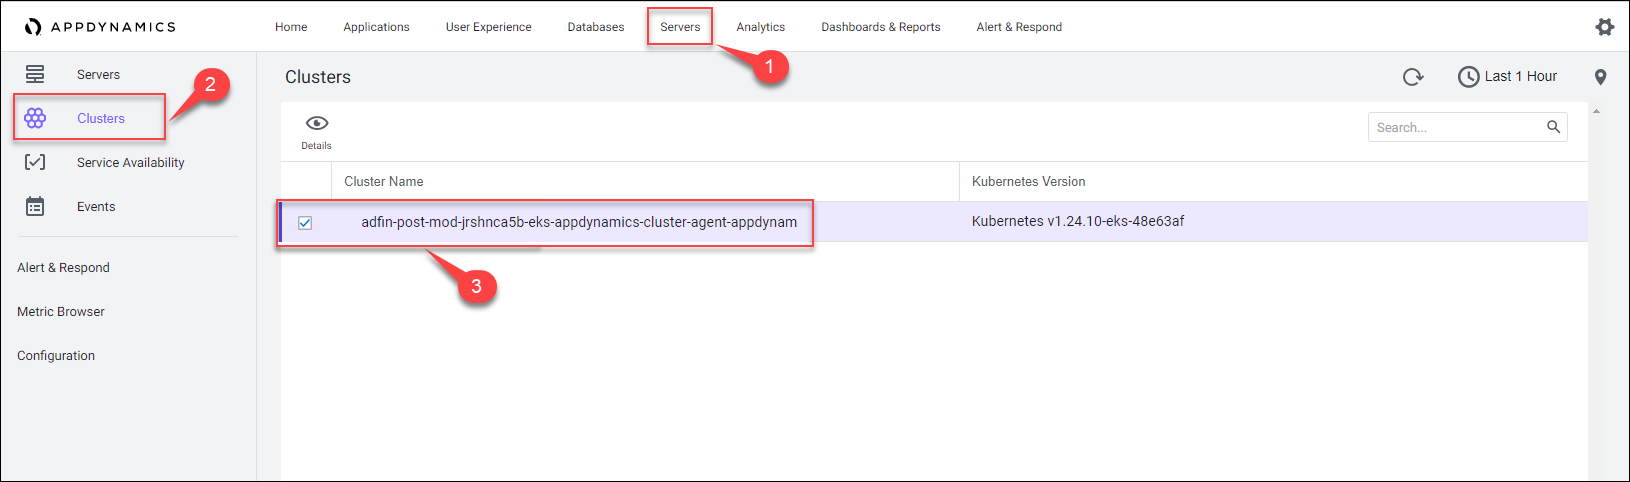
Let’s get started by navigating to the Cluster Agent dashboard.
1 . Click on the Servers option on the top menu.
2 . Click on the Clusters option on the left menu.
2 . Double-click on the cluster name that starts like this adfin-post-mod-<your_lab_user_name>-eks-appdynamics-cluster-agent
The Kubernetes cluster agent provides the following:
- Visibility into key Kubernetes metrics and events and detect uptime and availability issues
- Ability to diagnose issues that may impact uptime and diagnose scalability issues such as:
- Pod failures and restarts
- Node starvation
- Pod eviction threats and pod quota violations
- Image and storage failures
- Pending/stuck pods
- Bad endpoints: detects broken links between pods and application components
- Service endpoints in a failed state
- Missing dependencies (Services, configMaps, Secrets)
- Tracking of resource utilization of pods relative to the declared requests and limits
- Visibility into container logs from failed and restarted containers
- Correlation of container metrics to APM
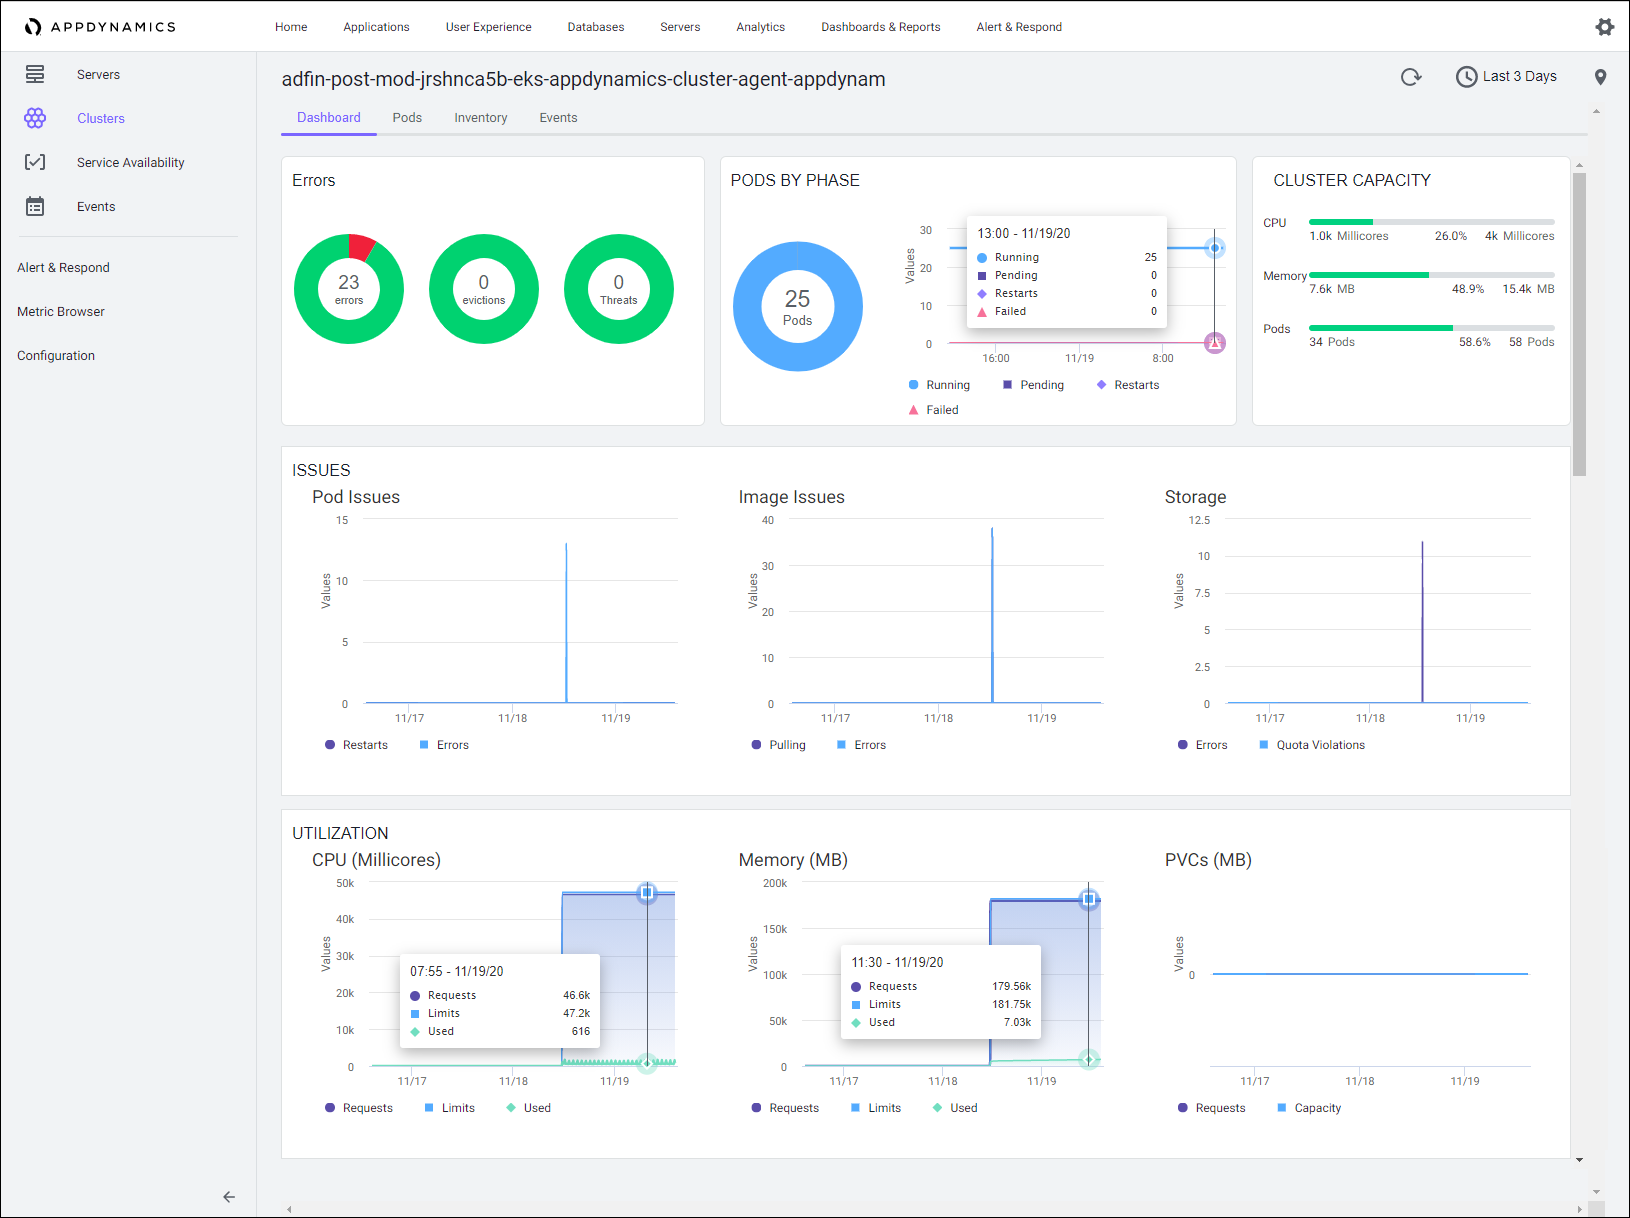
The main cluster dashboard provides an overall view of the health of the cluster. Views include a summary of errors that will impact cluster / app performance, cluster resource utilization, and quota utilization.
Cluster Events
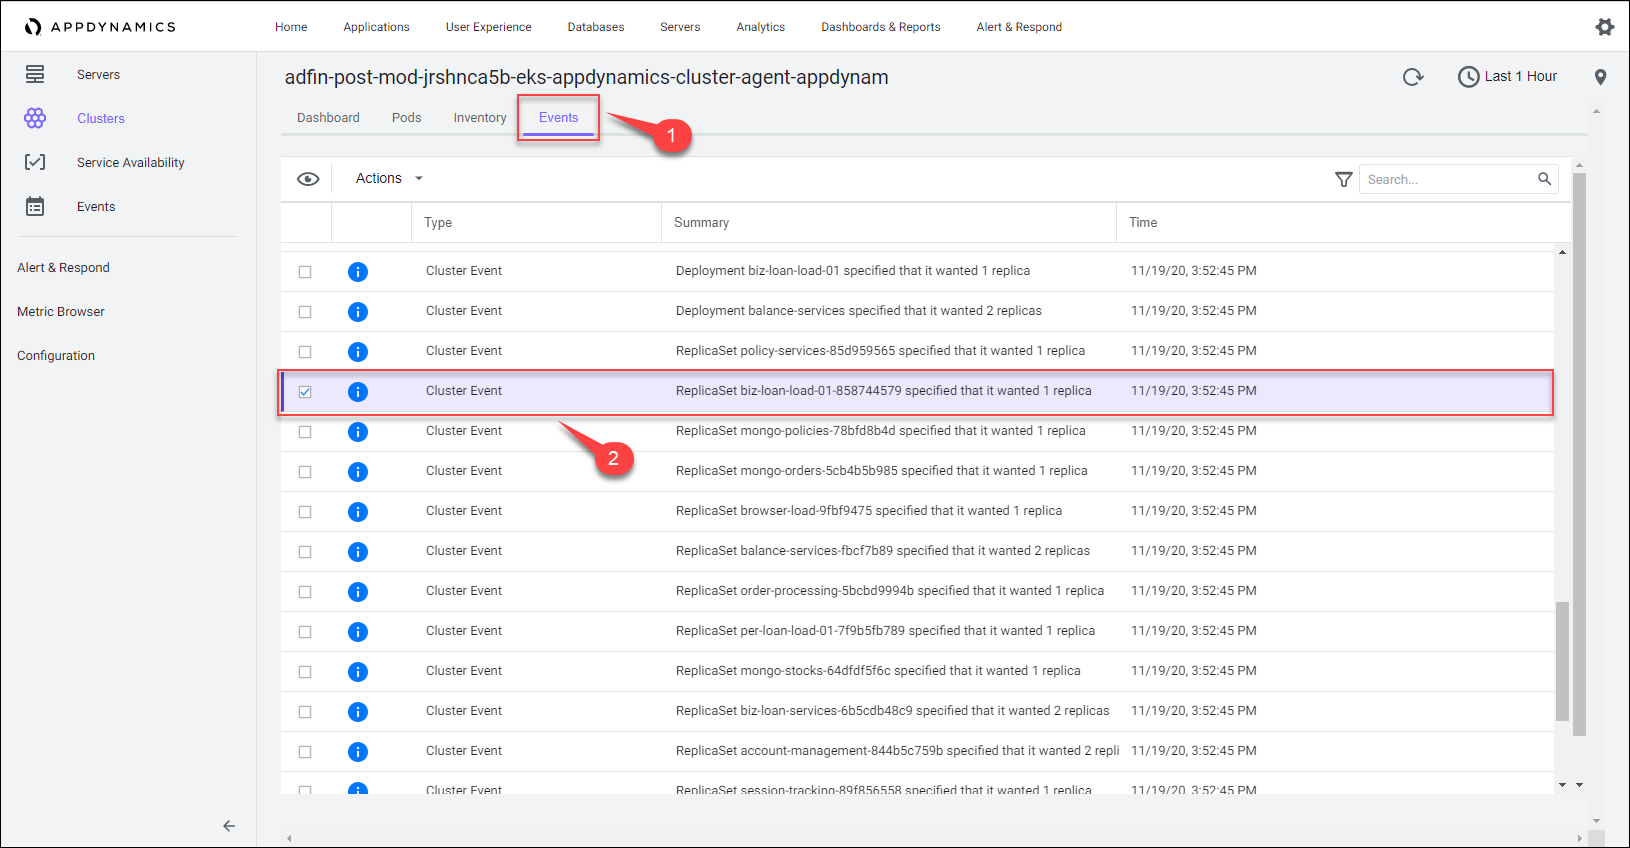
Next we’ll look at the cluster events. The events view displays the cluster events that are specific to the selected cluster. You can use the filter to view any specific event.
1 . Click on the Events tab.
2 . Double-click on one of the events to view the detail.
Cluster Inventory
The cluster inventory provides a view into the Kubernetes objects in use on this cluster. It’s a good area to verify the application deployment is utilizing best practices for deploying to Kubernetes (readiness and liveliness probes, resource limits, non-privileged pods, etc.).

Cluster Pods
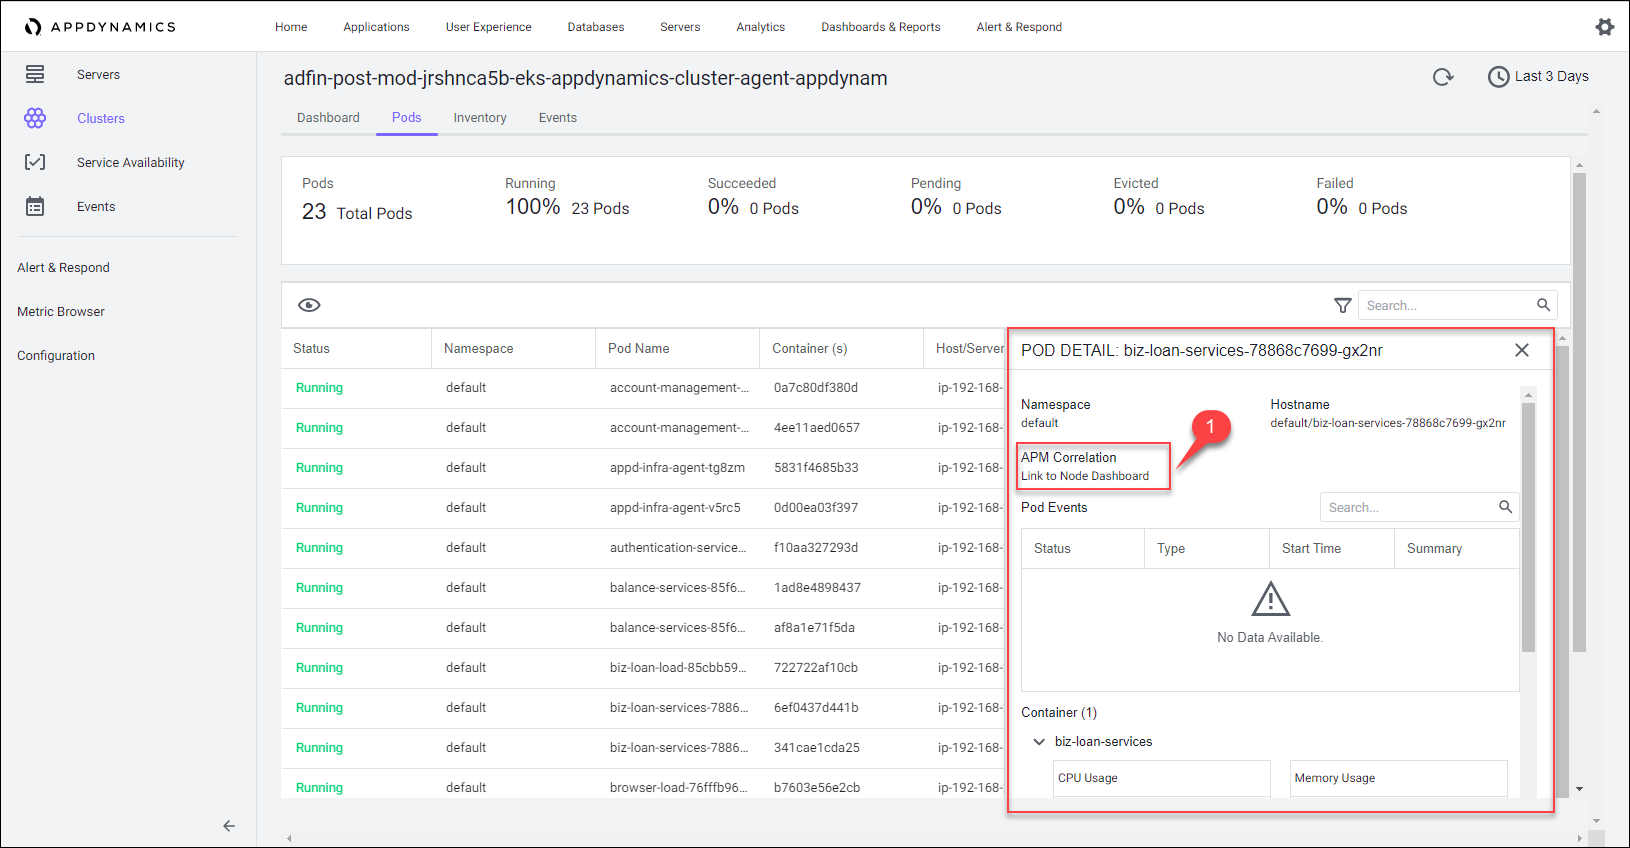
The cluster pods view gives us a list of all of the pods running within the cluster that are being monitored by the cluster agent. We can also see the CPU / memory utilization, the internal host, and the number of restarts that have occurred for each pod.
1 . Double-click on one of the pods to view the detail

1 . Because this particular pod is being instrumented by AppDynamics APM, the cluster agent is able to create a link to the appropriate node in the APM dashboard from this view. And with this linking, it’s much faster to be able to drill down to a potential root cause within the application.
Related Resources
Kubernetes Monitoring with AppDynamics
Top Five Docker Performance Tips
Kubernetes Monitoring Best Practices
Next
We’ll summarize what we’ve learned and start wrapping up the workshop!