Mobilize
Nathan is the Lead Architect for the modernization project at AD Financial. Nathan was instrumental during the initial migration of the first set of applications from the data center to AWS. Nathan understands the complexities and risks of moving and modernizing large production workloads and relies on the strategies, practices, and tools that have proven their value, leading to success.

The Mobilize, Modernize, and Operate sections of the workshop build upon the workshop setup by walking the user through the AppDynamics UI Dashboards.
In the past, IT teams had to create architecture diagrams for each application across their enterprise landscape. These quickly became obsolete and out-of-date as teams struggled to keep pace with the continual changes being made to the frontends and backends of their applications.
With AppDynamics, there’s no need to keep manually creating and updating architecture diagrams for your application. AppDynamics provides you with end-to-end OOTB dynamic visual representations for all the web pages, mobile views, components, services, hosts, backends, and depencies of your monitored application, all in direct context of the time frame you select.
When AD Financial first migrated its customer facing web application to AWS, Nathan had the AppDynamics advantage that assisted him and his team throughout the entire migration process.
Utilizing AppDynamics, Nathan and team can efficiently and effectively: - perform detailed application discovery - perform detailed application dependency analysis - priortize services to refactor - gather application baselines - create a viable modernization plan
Frontend Architecture
AppDynamics End User Monitoring (EUM) gives you deep visibility on the performance of your web and mobile applications. EUM helps you troubleshoot problems such as slow web, Ajax, mobile network requests, or IoT application errors. EUM provides metrics on application performance and user activity, such as:
- How server performance impacts your web, mobile, and device performance
- How third-party APIs impact your web, mobile, and device performance
- Where your heaviest loads originate
- How your users connect to and navigate your application
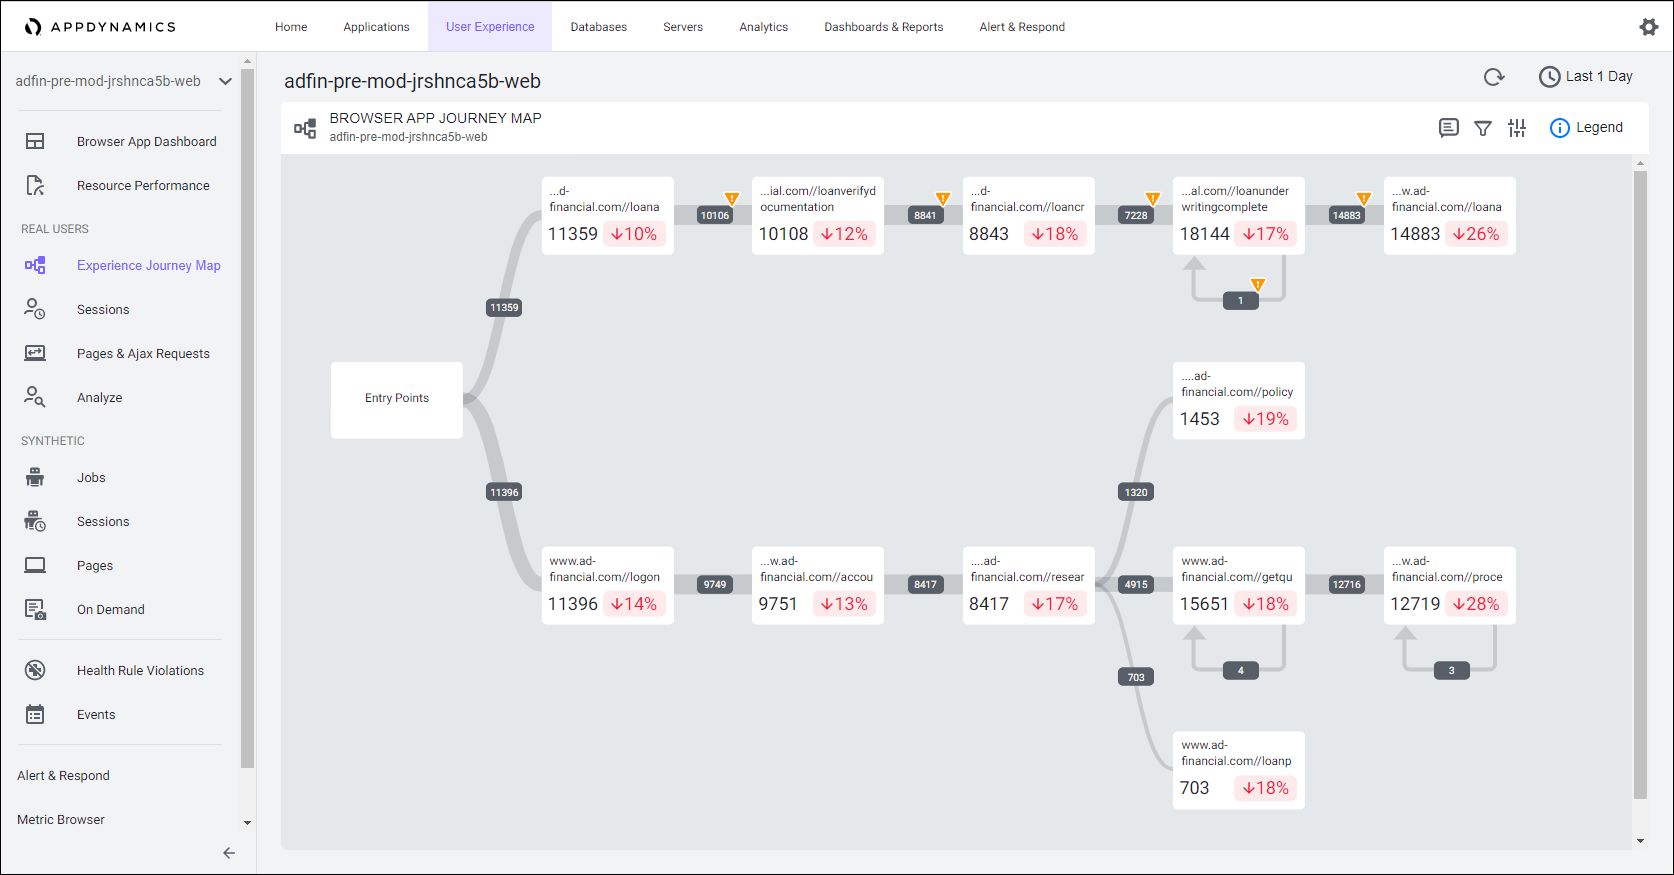
The AppDynamics Experience Journey Map provides a dynamic up-to-date view of your application frontend and maps out the pages, views, and actions and the path end users navigate through the frontend.
Backend Architecture
The AppDynamics Flow Map goes far beyond a basic architecture diagram.
It provides you much more than just “an inventory list”, such as:
- The response time:
- for the whole application
- for each service
- between each service
- to each dependency
- The calls per minute:
- for the whole application
- for each service
- between each service
- to each dependency
- The errors per minute:
- for the whole application
- for each service
- between each service
- to each dependency

Agent Configuration
Now let’s look at the different AppDynamics agents that have been applied to the pre-modernized application and review how they were deployed and configured. For some of the agents, we have used pre-packaged Docker images and for others, we have downloaded the agent binaries. You can read more about the different agent download options here.
Most types of AppDynamics agents require the five connection properties seen below. The setup script you executed previously in the workshop setup section, auto-populated the agent to controller configuration properties for you.
1. APPDYNAMICS_CONTROLLER_HOST_NAME
2. APPDYNAMICS_CONTROLLER_PORT
3. APPDYNAMICS_CONTROLLER_SSL_ENABLED
4. APPDYNAMICS_AGENT_ACCOUNT_NAME
5. APPDYNAMICS_AGENT_ACCOUNT_ACCESS_KEY
Our pre-modernized application is made up of micro-services in Docker containers and deployed with Docker Compose. To maintain modularity and reduce coupling of the application services to the agents, we’ve packaged the Java APM Agent and the Server Visibility Agent in separate Docker images.
Let’s take a look at the “application.env” file for the Docker application that has the agent to controller connection properties defined by using the commands below:
cd /home/ec2-user/environment/modernization_workshop/applications/pre-modernization

cat -n application.env
You should see the five controller connection properties and their values defined. You can read more about the Agent to Controller Connection properties here
Java APM Agent
In the “application.env” file you’ll see the “APPDYNAMICS_AGENT_APPLICATION_NAME” property. This property is used by the Java Agent to know what APM application name to report to within the Controller.
Let’s take a look at the “docker-compose.yaml” file that is used to define the containers/services that comprise the application.
cd /home/ec2-user/environment/modernization_workshop/applications/pre-modernization
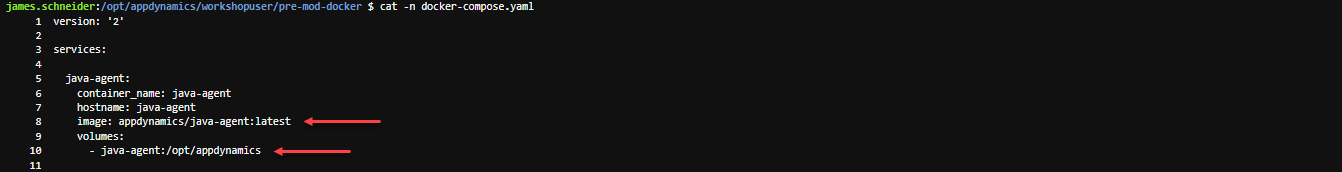
cat -n docker-compose.yamlIn the section of the file seen below, we are defining the Java Agent as a service and referencing a pre-built Docker image of the Java Agent.
Where do we reference the Docker image of the Java Agent ? - on line 8 we are providing the reference to the pre-built public image that can be found here
How do we expose the directory on the image where the Java Agent binaries can be accessed by the other service containers that reference it ? - on line 10 we are specifying the file system location of the binaries
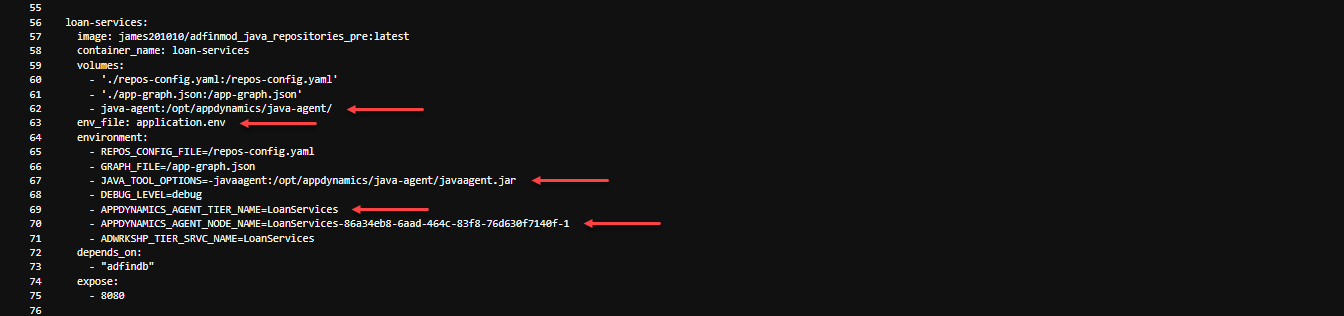
Scroll down the file until you get to line 56. Here we see the entire definition for the *“loan-services”* container/service.
Notice that the loan services has its own image defined containing just the application code (e.g. line 57).
How do we then load the binaries for the Java Agent into the application container ? - on line 62, under the volumes section, we are pulling in the shared volume/directory from the java-agent container
How does the Java Agent obtain its connection properties to the controller ? - on line 63, we’re pulling in the “application.env” file that contains those as well as the APM application name
How does the Java Agent get bootstrapped into the application JVM startup ? - on line 67, we’re telling Docker to add the Java Agent bootstrap parameter to the JVM startup
How does the loan-services container/service get its Tier and Node name assigned ? - on line 69 and 70, we are defining the Tier name and Node name
You can examine the other services in the docker-compose.yaml file to see the specific definitions that include the Java Agent in the exact manner as described above, with the exception of Tier and Node name differences.
You can read more about building the Java Agent into your own Docker Image here
Server Visibility Agent
The Server Visibility Agent used with a Docker Compose application differs from the Java Agent in that:
- only one instance of the Server Visibility Agent should be deployed on a given host/VM
- it runs in its own container within its own JVM on a single host/VM
- the Server Visibility Agent does not require the definition of an application, tier, or node name, since it scans the process list/containers on the host/VM to find AppDynamics APM agents in use and relates itself to those processes/containers
The Server Visibility Agent used with a Docker Compose application is similar to the Java Agent in that: - it should be defined as a service within the same docker-compose.yaml file - it will use the same controller connection properties defined in the application.env file - we are using a pre-built Docker image of the agent for this workshop - you have the option of building your own Docker image of the agent in your own repository
If needed, run the commands below to view the docker-compose.yaml file again:
cd /home/ec2-user/environment/modernization_workshop/applications/pre-modernization

cat -n docker-compose.yaml
Scroll down the file until you get to line 12. Here we see the entire definition for the *“machine-agent”* AKA the Server Visibility Agent.
We are defining the Server Visibility Agent as a service and referencing a pre-built Docker image for it on line 14 that can be found here
How does the Server Visibility Agent obtain its connection properties to the controller ? - on line 16, we’re pulling in the “application.env” file that contains those properties
What additional properties are needed for the agent ? - the property on line 18 is required if you want to collect more than minimal host level metrics - it is highly recommended to replicate lines 19 and 20 as well if using an older agent version

You can read more about building the Server Visibility Agent into your own Docker Container Image here
Database Visibility Agent
The AppDynamics Database Agent is a standalone Java program that collects performance metrics about your database instances and database servers. You can deploy the Database Agent on any machine running Java 1.8 or higher. The machine must have network access to the AppDynamics Controller and the database instance that you want to be monitored.
A single database agent can monitor multiple databases at once by using multiple database collector configurations. The workshop setup utility installed the agent on your Cloud9 instance and also created two database collector configurations inside the controller. You can see the running agent process by using the command below:
ps -ef | grep db-agentIn the case of the database agent, JVM command line properties were used to connect the agent to the controller. Take notice of the “-Ddbagent.name” property. This property is used to link a specific database agent to a database collector configuration. Most of these properties could have optionally been defined in the agents configuration file, which can be seen by using the commands below:
cd /opt/appdynamics/dbagent/conf
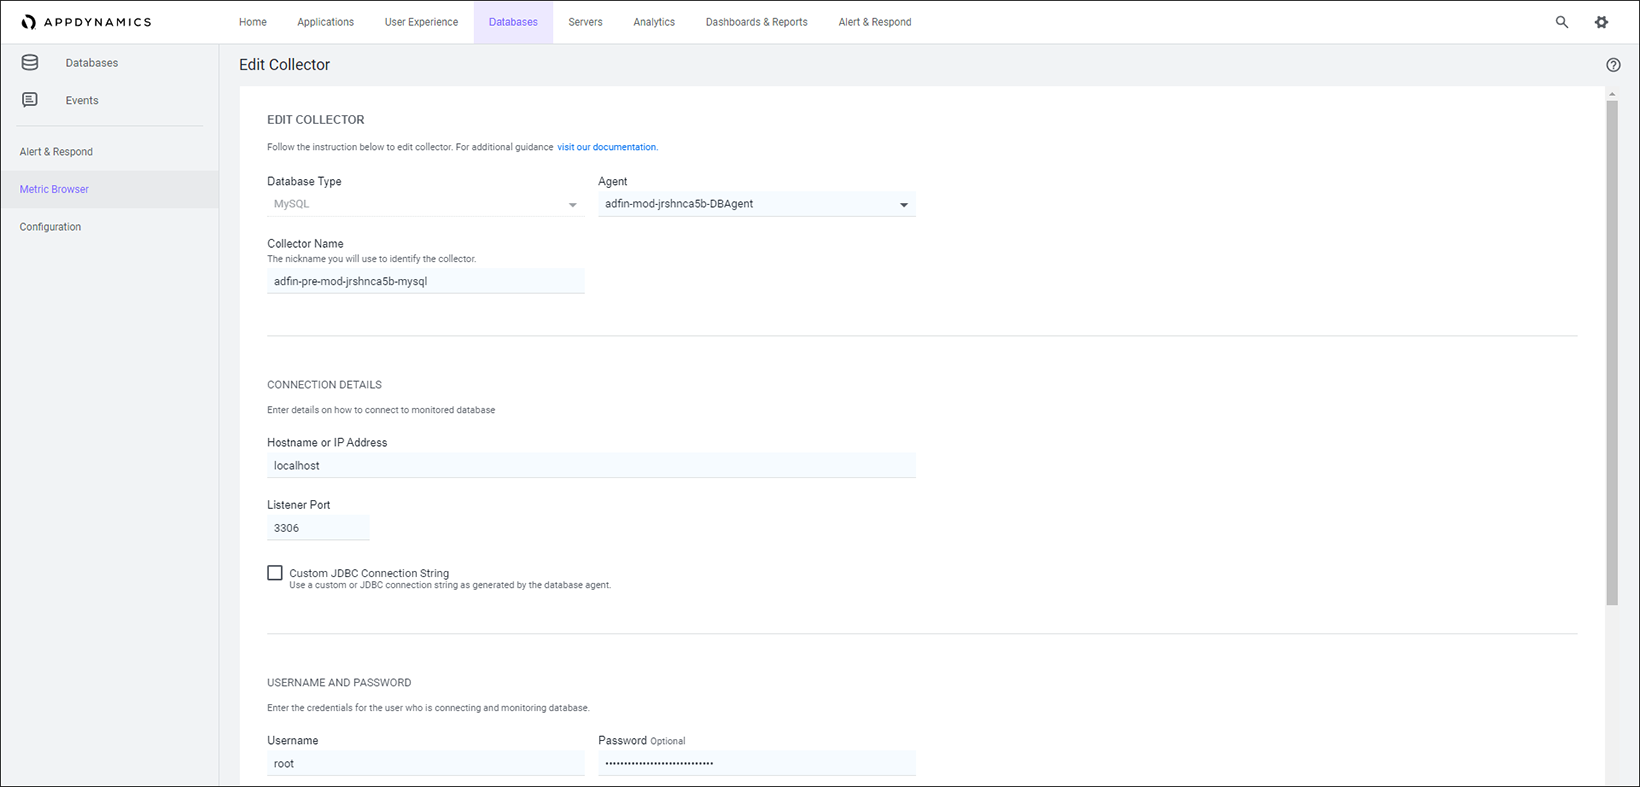
cat controller-info.xmlThe image below shows an example of the database collector configuration to monitor the MySQL database used in the pre-modernized Docker Compose application.
Once the database agent is running with a specific name, its name should appear in the drop-down of available agents so you can associate it with the collector you’re creating. Since the database agent is running on the same host as our Docker Compose application and the MySQL DB running within it, we have used “localhost” as the hostname. We can use the port “3306” for the DB since we have exposed it specifically in the “docker-compose.yaml” file.
You can see that we have used the “root” username and password to connect to the database and monitor it. The recommended practice is to create a specific database user in the database and apply specific permissions to it for monitoring purposes.
You can read more about deploying the database agent and configuring collectors here and here
Next
Let’s follow Nathan and his team as they utilize AppDynamics to perform a detailed analysis of the following aspects of the pre-modernized application in its current state:
- Differentiate issues in the web UI versus the backend services that support it
- Identify all application components, the hosts they run on, and their resource utilization
- Identify all dependencies to backends and dependencies across service APIs
- Identify transactions associated with loan processing that would be effected when decoupling services
- Identify the path those transactions take through the system with all components involved to map them out
- Identify specific components that are causing performance degradation of key business transactions