Accelerate

Once the new architectural components were selected, Nathan, the architect we met earlier, worked with Alex and his team to take advantage of AppDynamics to once again see the real time topology of the application. Not only did this allow the teams to quickly understand all of the differences in terms of the application components, but it also enabled them to get immediate insight into how much better the overall application performance was after the modernization effort was completed.
Navigate to the Modernized APM Application
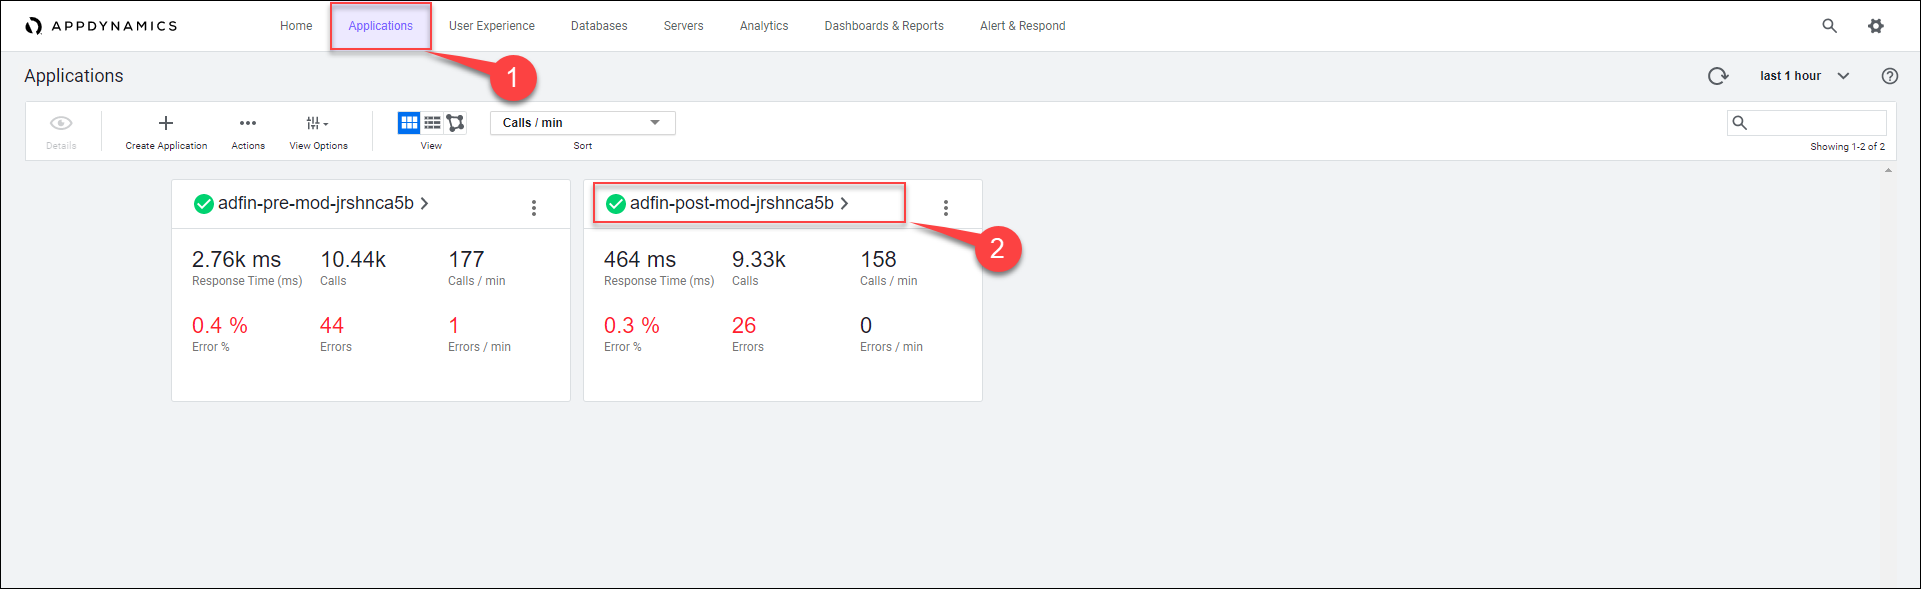
Let’s start by finding the modernized version of the AD Financial APM (App Performance Monitoring) application and open it to investigate the flow map.
1 . Click on the Applications tab on the top menu, you should see the application named like adfin-post-mod-<your_lab_user_name>
2 . Click on the application name to drill into the flow map view for the application.
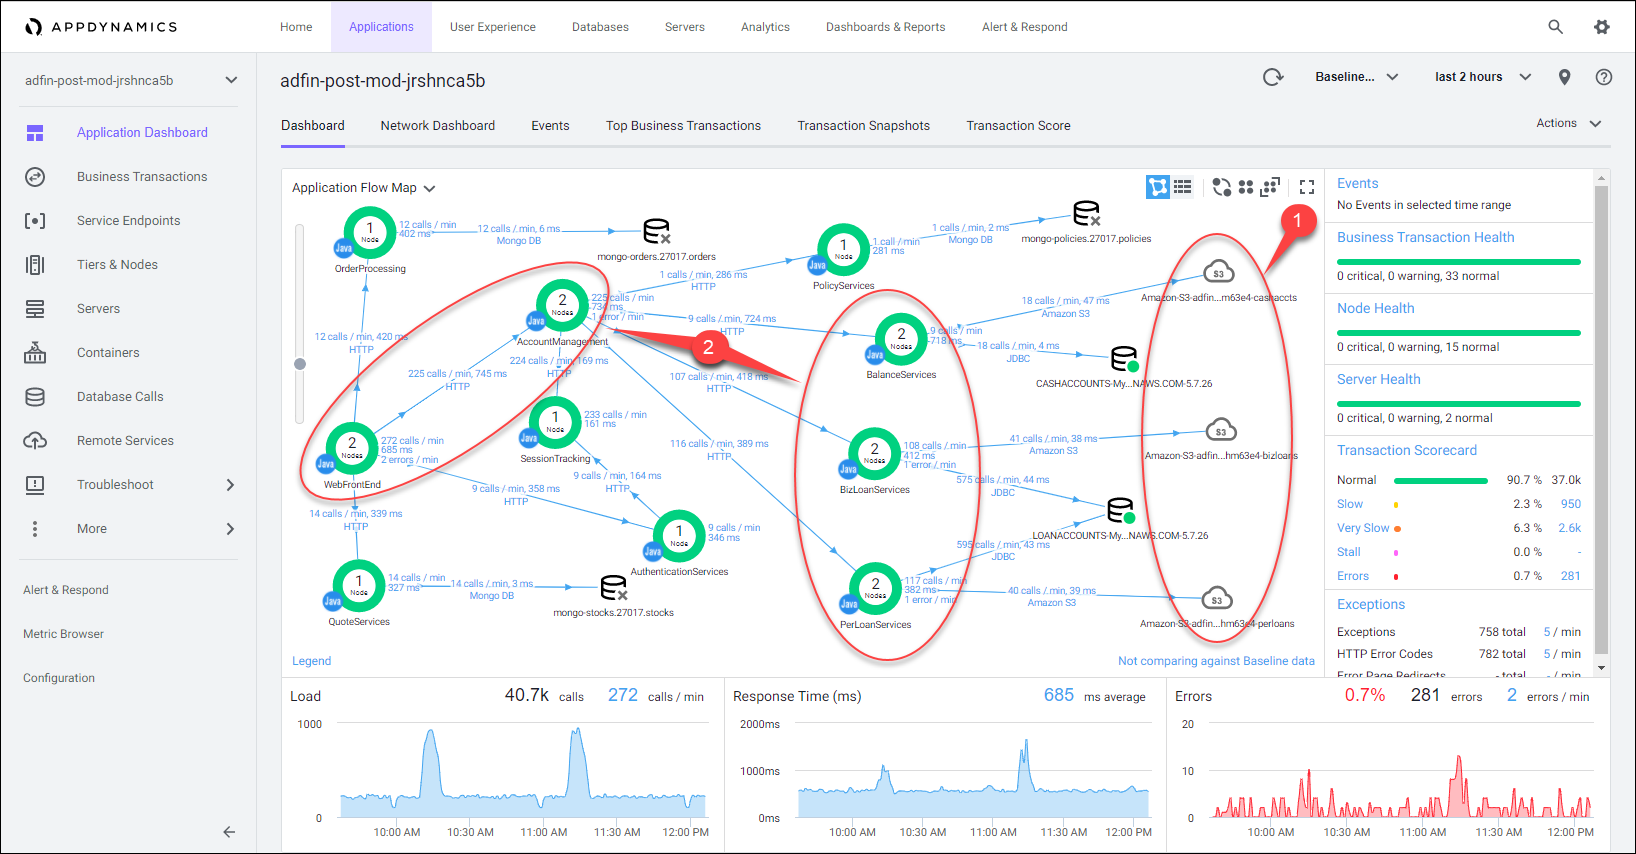
Application Level Flow Map
You can now see that AppDynamics shows an updated flow map that reflects the new components utilized such as the S3 remote services. Since the application team is now benefitting from the advanced container management capabilities of EKS, they were able to easily scale out many of the tiers as shown by the number of nodes inside the green circle. If you look back at the pre-modernized version of AD Financial you will see only 1 node supporting each tier. This was another risk that was addressed since there were multiple single points of failure prior to the modernization.
1 . S3 buckets used to archive audit data are automatically detected, mapped, and performance recorded.
2 . With EKS, increasing the number of nodes/pods for a service tier becomes a simple task, achieved within minutes.
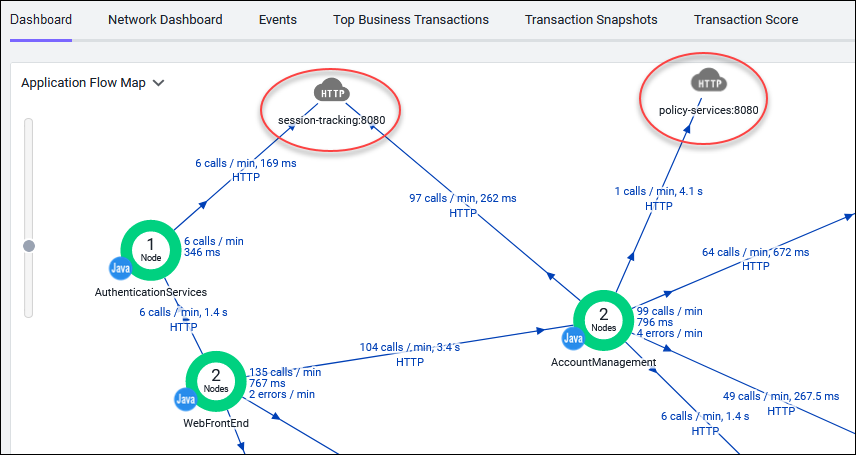
If you see any of the services in the application showing up as HTTP instead of a Tier as depicted in the image below, then use the commands, shown below the image, to re-deploy the EKS application and this should fix the issue.
cd /home/ec2-user/environment/modernization_workshop

./redeploy_eks_application.sh
1 . Notice that we now have separation for the tiers supporting the Business and Personal Loan services.
2 . Notice the dramatic improvement of the transaction performance compared to the pre-modernized version of the application.
2 . We can see that the average response time has substantially decreased even as the load has almost doubled in comparison.

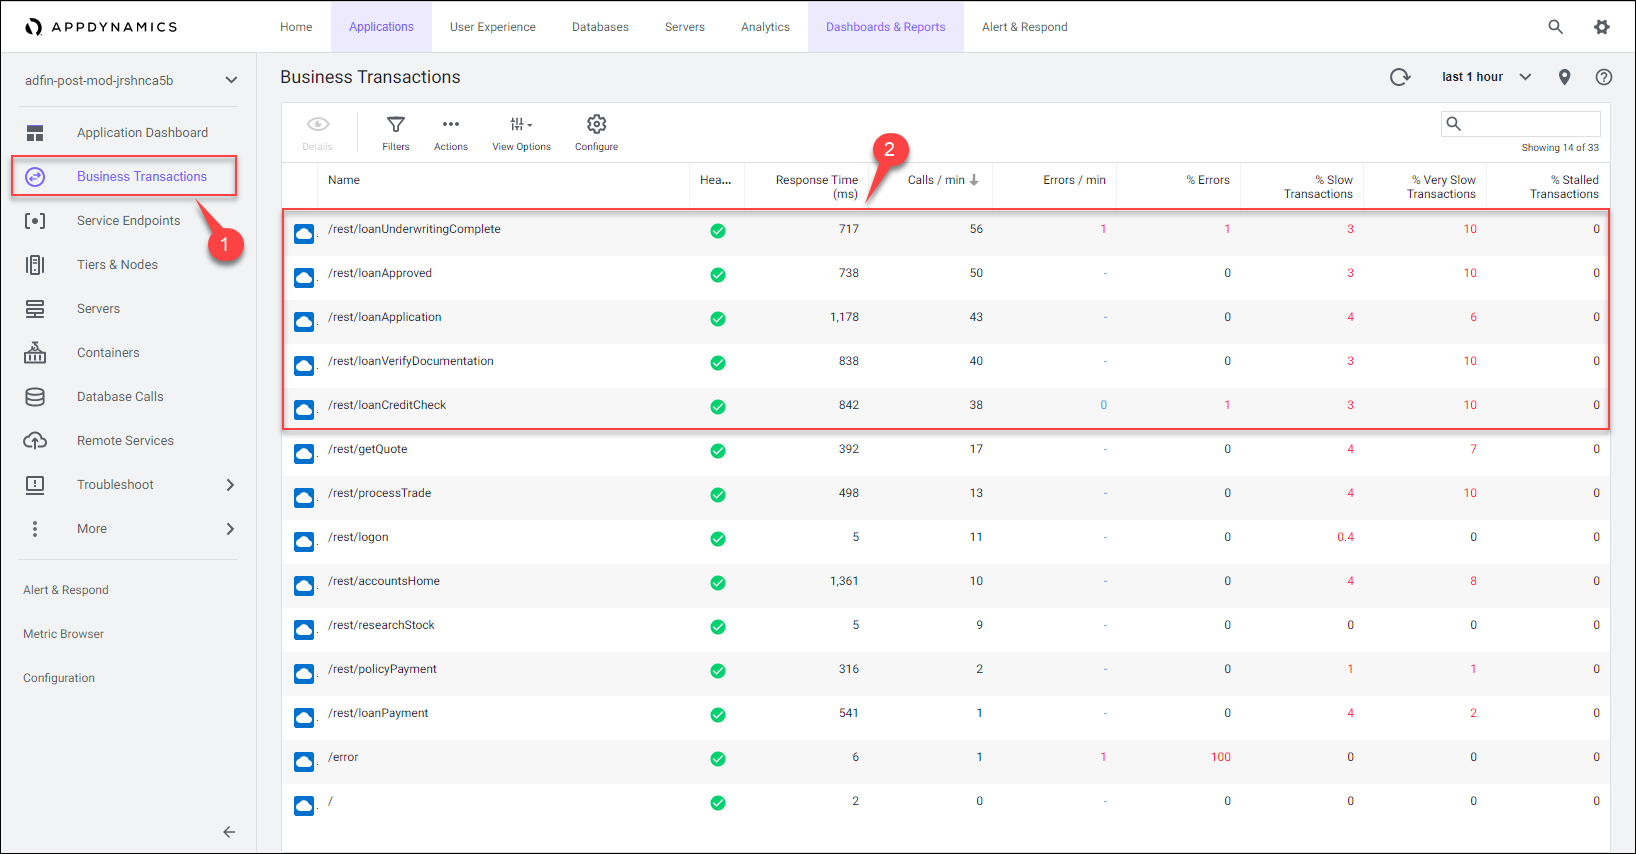
Business Transactions
Earlier we identified that the business transactions associated with loan servicing that should be prioritized during modernization. It is critical that we optimize the performance for those key business transactions. Let’s now take a look at those same business transactions and see how their performance has changed.
1 . Click on the Business Transactions option on the left menu.
2 . Review the improved response times of the key business transactions associated with loan servicing.
There has now been significant improvement in the average response times of these critical transactions associated with loan processing. We also see that far less of these individual transactions are being graded as slow or very slow as shown by the percentages in the table. Recall that AppDynamics will count, measure and score every single business transaction against a learned dynamic baseline. This is paramount to empower a team to quickly see when certain transactions are degrading and performing poorly.
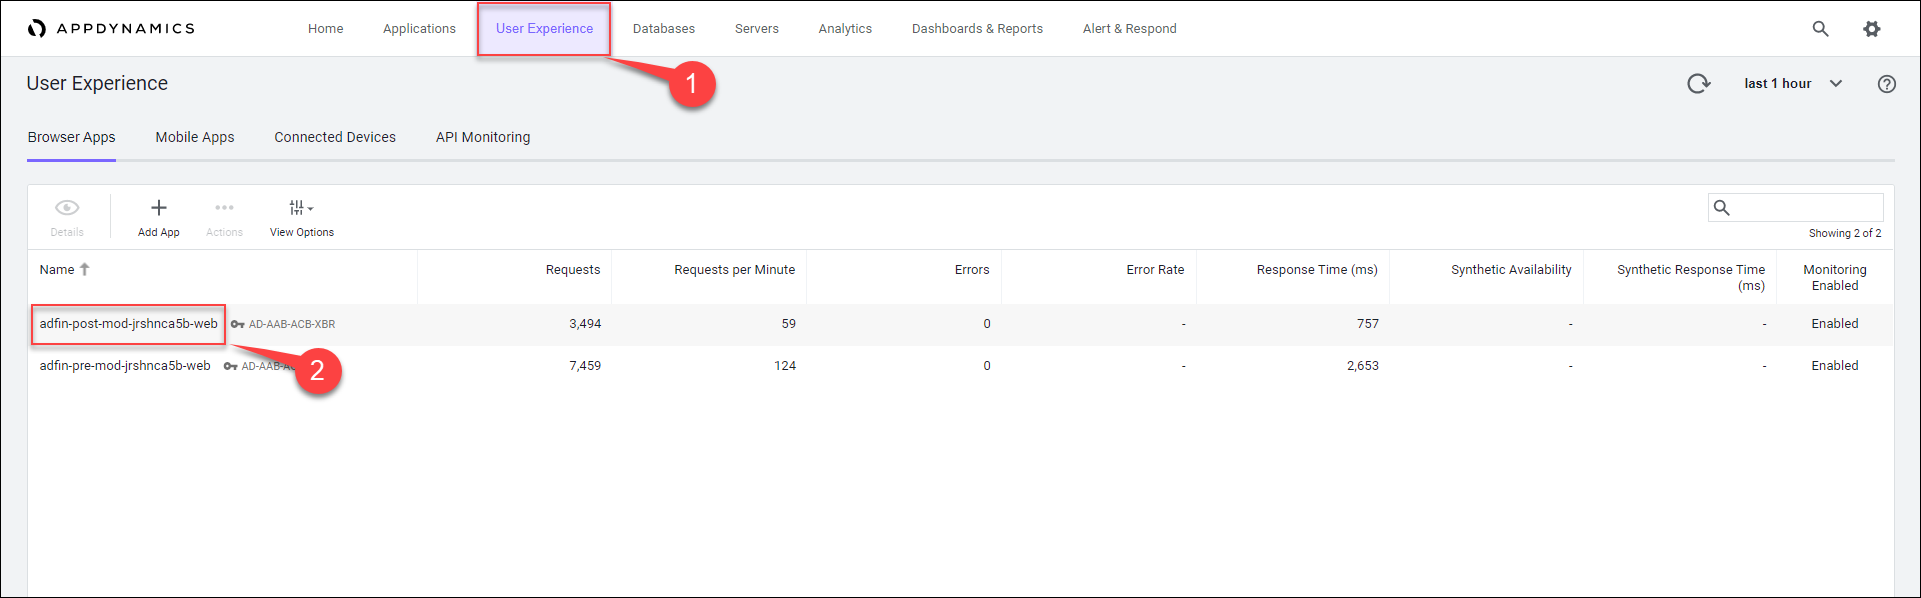
Navigate to the BRUM Application
Next let’s go to the post-modernized version of the AD Financial BRUM (Browser Real User Monitoring) application and open it using the steps below.
1 . Click on the User Experience option on the top menu.
- In the list of Browser Apps you should see the application named like adfin-post-mod-<your_lab_user_name>-web
2 . Click on the application name to open the Overview Dashboard for the application.
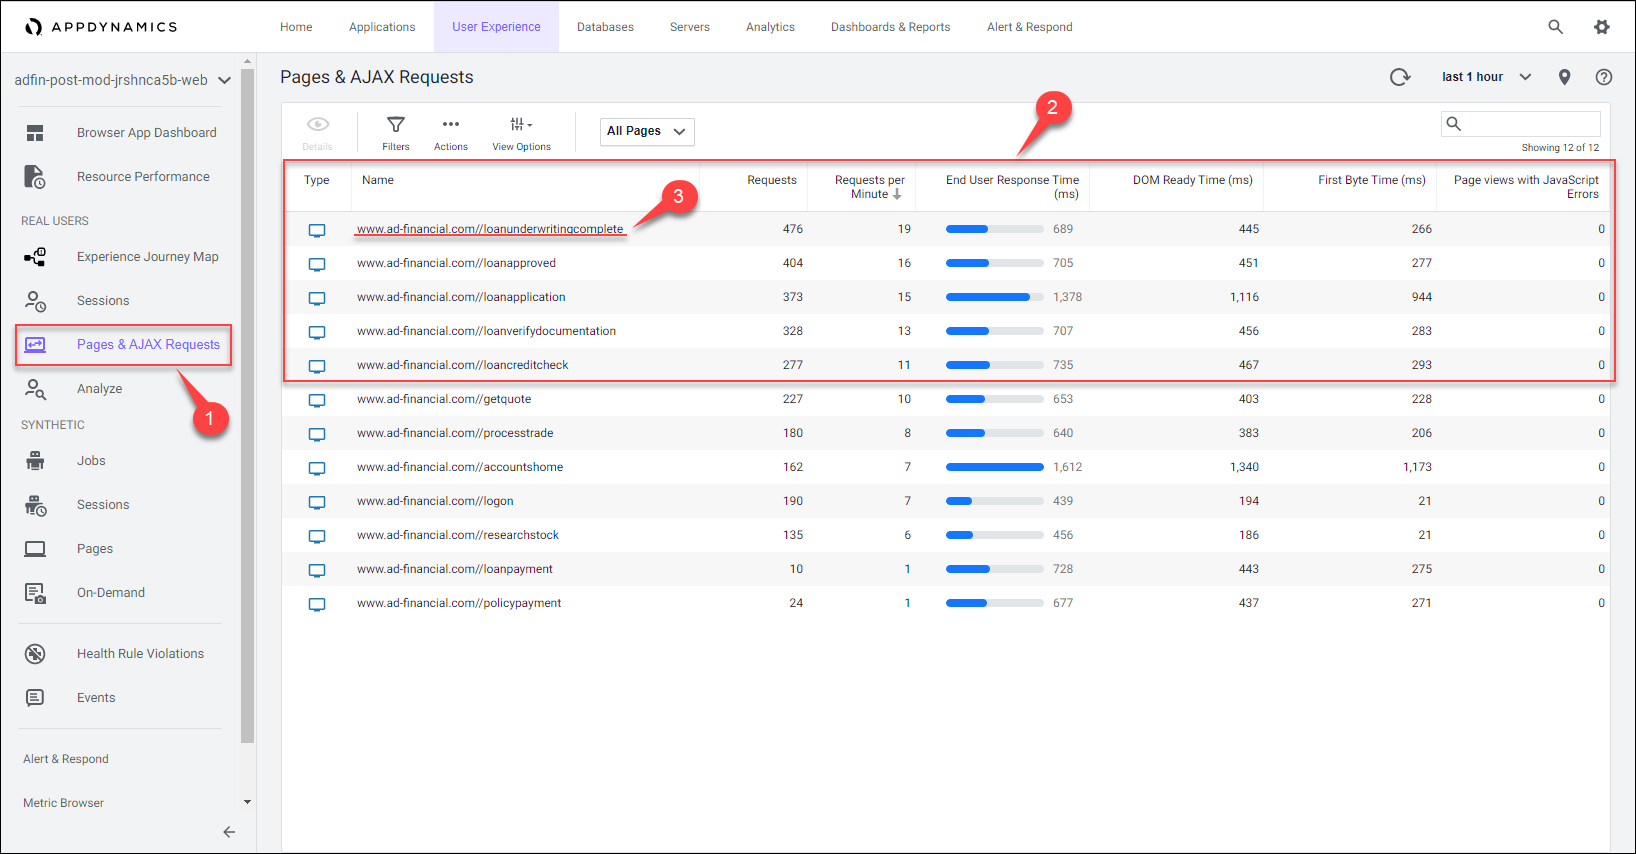
We can observe the performance increase seen for the pages associated with loan processing by following the steps below.
1 . Click on the Pages & AJAX Requests option on the left menu.
2 . Notice that the loan pages have much lower average response times than the pre-modernized version of the application.
3 . Double-click on the loanunderwritingcomplete page to see more detail about that web page.
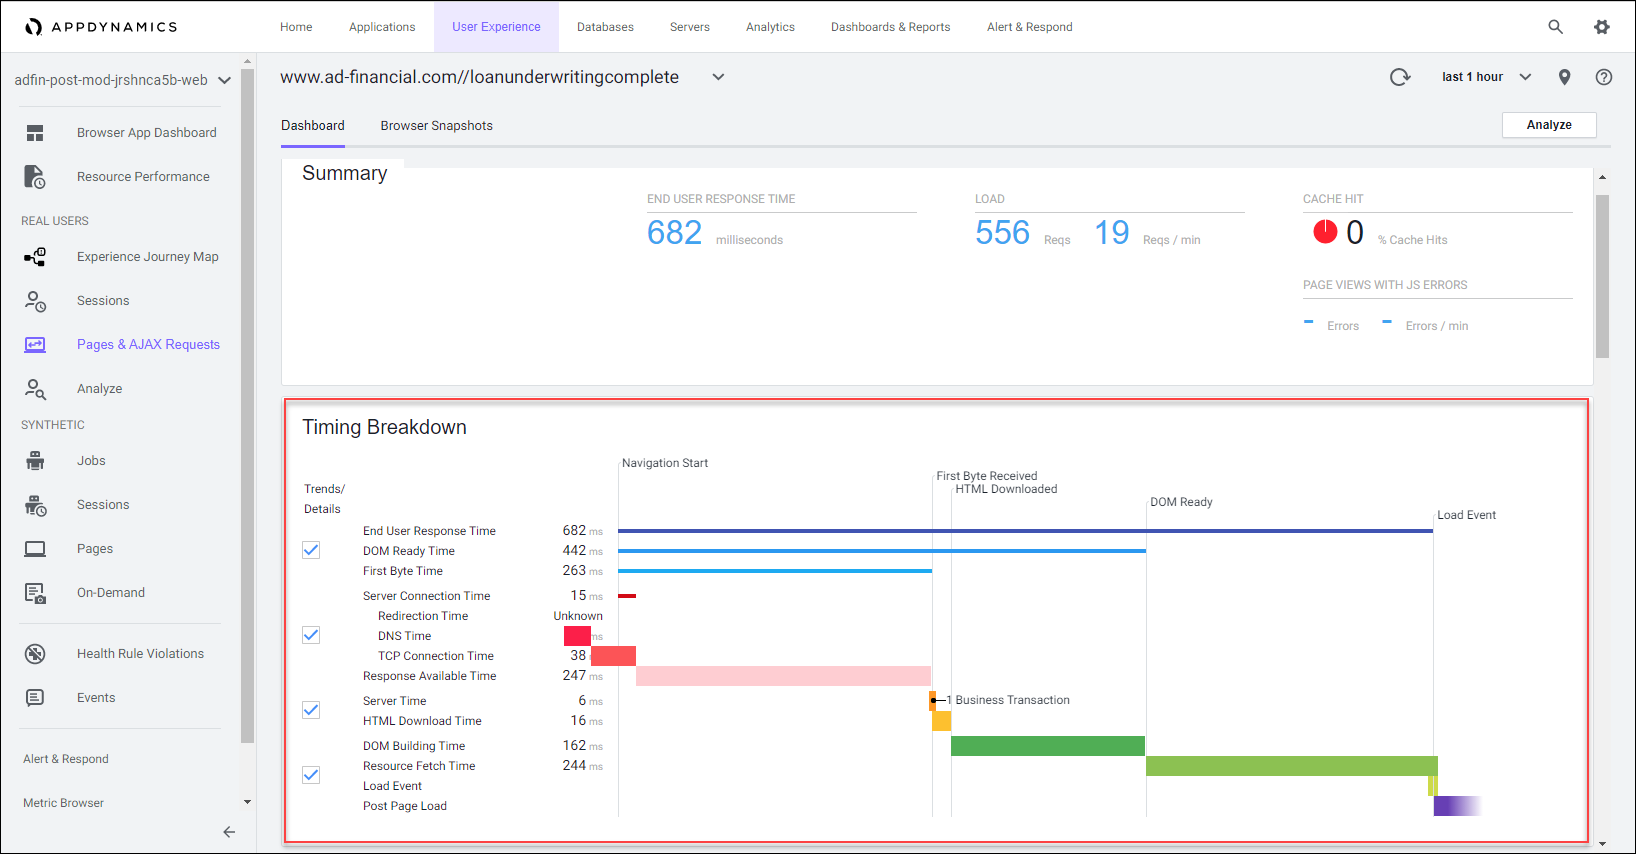
From here you can understand the breakdown of the End User Response Time for this page. The waterfall graph shown below displays the average times for the time frame selected for each aspect of the page load process. For more information on each of the metric measurements, hover over its name on the left. A popup appears with a definition of the metric.
You can read more about the Browser Page Timing Breakdown here
Here’s the Advantage
- Get immediate insight to the improvement of the overall application performance as you refactor and modernize
- Instantly validate the availability and performance of application components and the cloud services they utilize
- Easily confirm that the critical business transactions are providing improved functionality and throughput across services
Next
In the next section we’ll look at how the development team scaled the application with the cloud services they utilized.