Scale

Remote Services - S3
In addition to the flow map reflecting all of the changes in the real time topology of the application, we can view Remote Services to show the detailed metrics of the calls to the new secure storage solution, S3.
1 . Click on Remote Services on the left menu.
2 . Notice the sub-second response time for all the S3 calls.
You can read more about Remote Services here

Databases - RDS
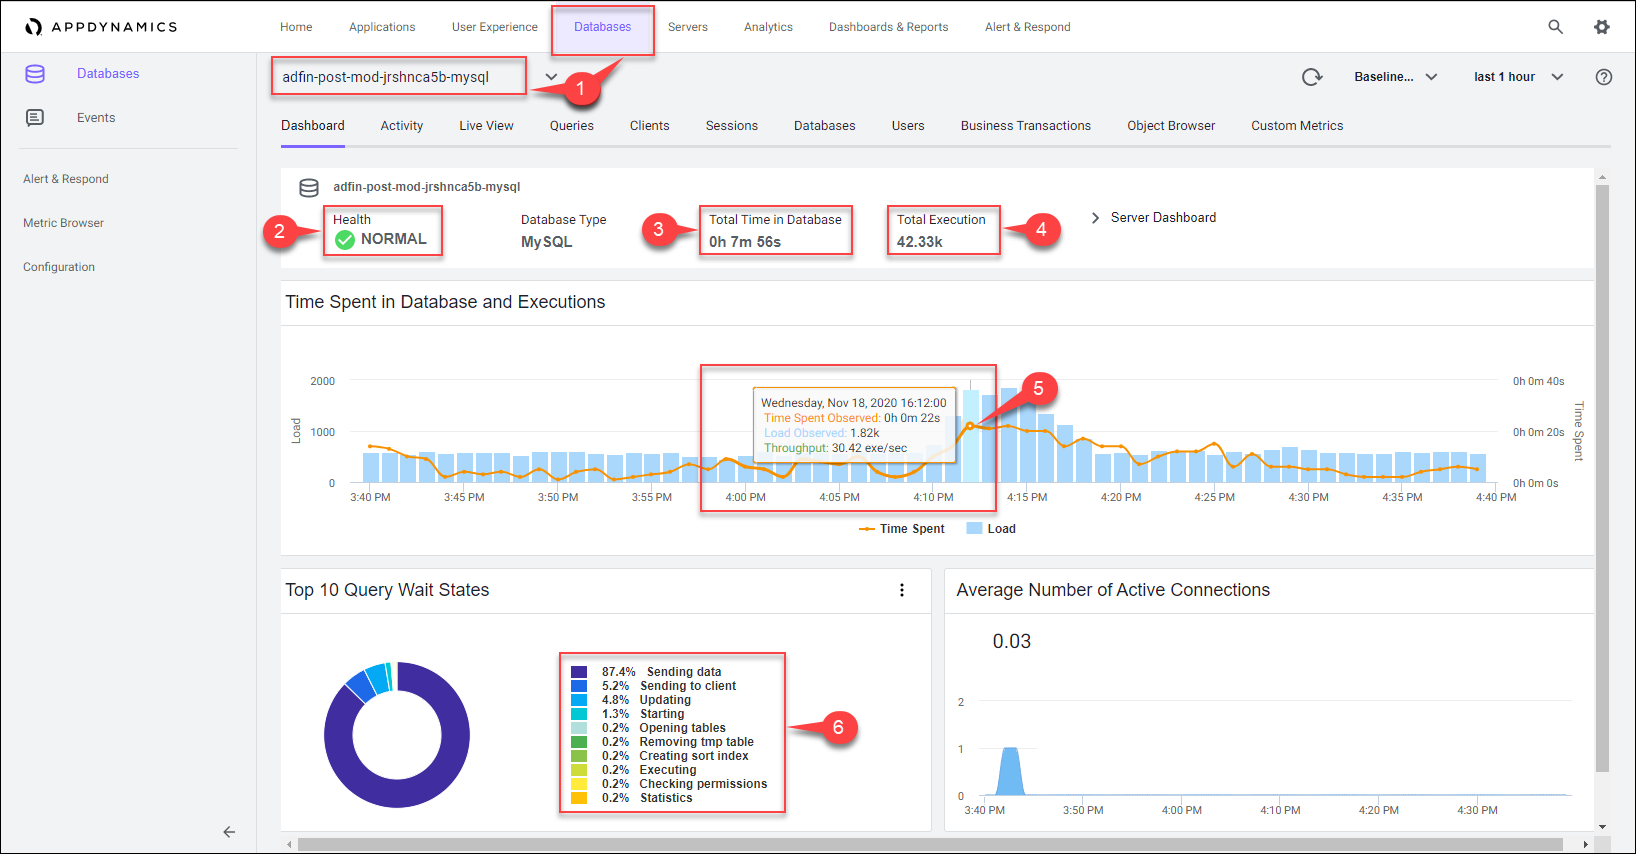
The native MySQL database used in the pre-modernized version of the application was straining to keep up with the demand of the application load. Let’s take a look at how much better the new AWS RDS MySQL database is performing.
1 . Navigate to the database named like adfin-post-mod-<your_lab_user_name>-mysql
2 . Click on the colored health status circle to see details of the server health
3 . Observe the total time spent executing SQL statements during the specified time period
4 . Observe the total number of executions during the specified time period
5 . Hover over the time series on the chart to see the detail of the recorded metrics
6 . Hover over the labels for each wait state to see a more detailed description
Here’s the Advantage
- Easily compare and validate the throughput and resource usage of the hosts and containers in the application
- Quickly observe the availability and performance of the cloud services within the application context
- Understand database performance in detail to validate improvements after modernizing with RDS
Next
In the next section we’ll examine how AppDynamics Business iQ provides deep visibility into key real-time business metrics correlated to application performance.